Figure 1.
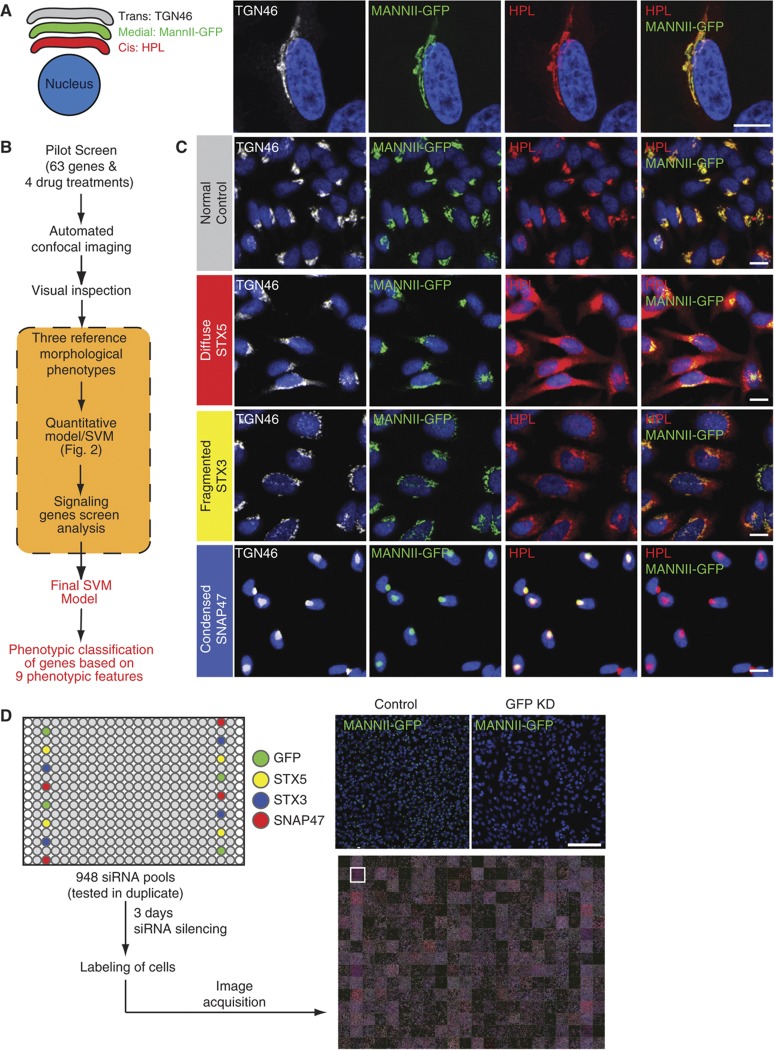
An imaging-based screen to identify Golgi organization phenotypes. (A) HeLa MannII-GFP (medial Golgi) cells were stained with cis Golgi marker HPL and trans Golgi marker TGN46. Compartments co-localized extensively even at × 100 magnification. Scale bar: 10 μm. (B) Schematic overview of the screening process. A pilot screen of 63 genes and 4 drug treatments was imaged using a × 20 objective and visually screened for changes in Golgi organization. Three Golgi phenotypes (diffuse, fragmented and condensed) were identified and used to train a preliminary Support Vector Machine (SVM) for quantitative scoring of treatments. Images of selected genes from the signaling genes screen (see Supplementary Figure S2A) were used to refine SVM training and obtain a final score. (C) Examples of the three reference phenotypes. STX5 knockdown induces a diffuse phenotype specifically for the cis Golgi while STX3 and SNAP47 knockdown induces a fragmented and condensed Golgi in all three compartments, respectively. Scale bar: 30 μm. (D) Workflow of the siRNA screen. Screen plates were loaded with controls for the three phenotypes for quality control in each plate. GFP knockdown and STX5 knockdown demonstrate homogeneous gene depletions in all wells seeded with the siRNAs. Scale bar: 200 μm.

