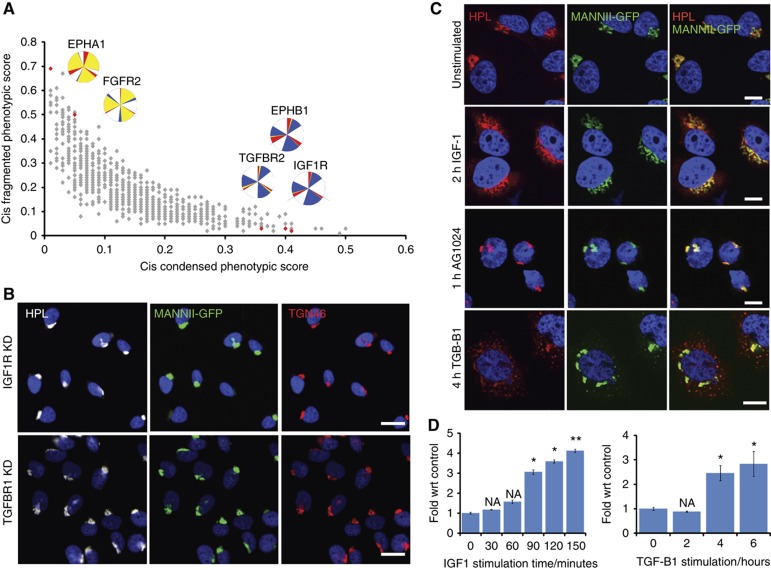
Figure 6.
Cell surface receptors control Golgi organization. (A) Plot of cis fragmented against cis condensed phenotypic scores for signaling genes. (B) Golgi staining of different compartments in IGF1R and TGFRB1 depletion reveals a typical condensed Golgi phenotype. (C) Golgi staining after cell stimulation with IGF1R ligand IGF1 for 2 h (top) and TGFBR1 ligand TGF-B1 (bottom) or treatment with the IGF1R inhibitor AG1024 for 1 h (middle). Images acquired at × 60 magnification. (D) Quantification for Golgi fragmentation in IGF1 (left) and TGF-B1 stimulation (right) over various time points. Values on graphs indicate the mean±s.e.m. *P<0.05, **P<0.0001 by two-tailed unpaired t-test, relative to untransfected or GFP siRNA-treated cells.

