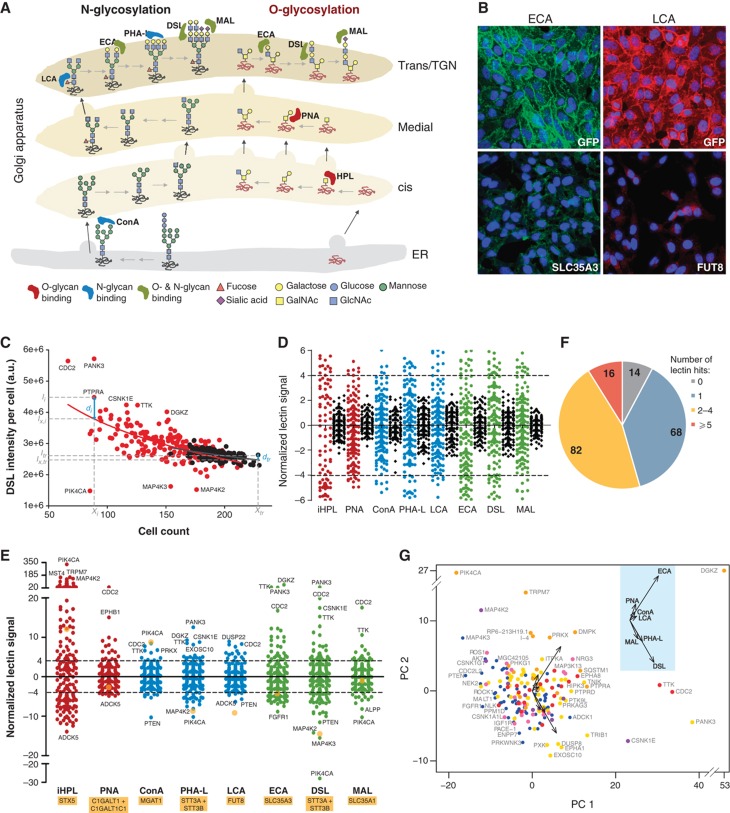
Figure 7.
166 signaling proteins regulate Golgi morphology and glycans expression. (A) Schematic of the main glycan structures bound by the lectins used in the secondary screening. (B) ECA (left) and LCA (right) lectin staining after 3 days knockdown of the indicated negative (GFP) and positive (SLC35A3, Golgi UDP-GlcNAc transporter; and FUT8, fucosyltransferase 8) control genes. (C) DSL lectin intensity per cell (arbitrary units) against cell count for each of the primary hit genes (red) and control wells (black). Each data set is fit to a log equation (see Materials and methods) and the resulting fits (solid lines) represent the expected intensity under unperturbed conditions. A normalized lectin signal for each gene is then calculated in relation to the mean absolute deviation of control wells (see Materials and methods), as a measure of extent of perturbation. (D) Normalized lectin signals of control wells (black) in comparison with signaling genes (colored), for all lectins tested. Dotted lines indicate hit cutoff values of 4 and −4. (E) Complete zoomed out plot of (D), with some extreme genes labeled. Yellow filled circles represent the normalized lectin signal for control genes (indicated below lectin names). (F) Overview of the distribution of the number of lectin hits per gene. The corresponding numbers of genes are indicated on the chart. (G) Principal Component Analysis plot of the seven lectin scores (excluding HPL; see also Supplementary Figure S10C) for each hit gene. Genes are color coded according to the six Golgi morphology groups as indicated. Inset: Eigen vectors with the respective lectins labeled.

