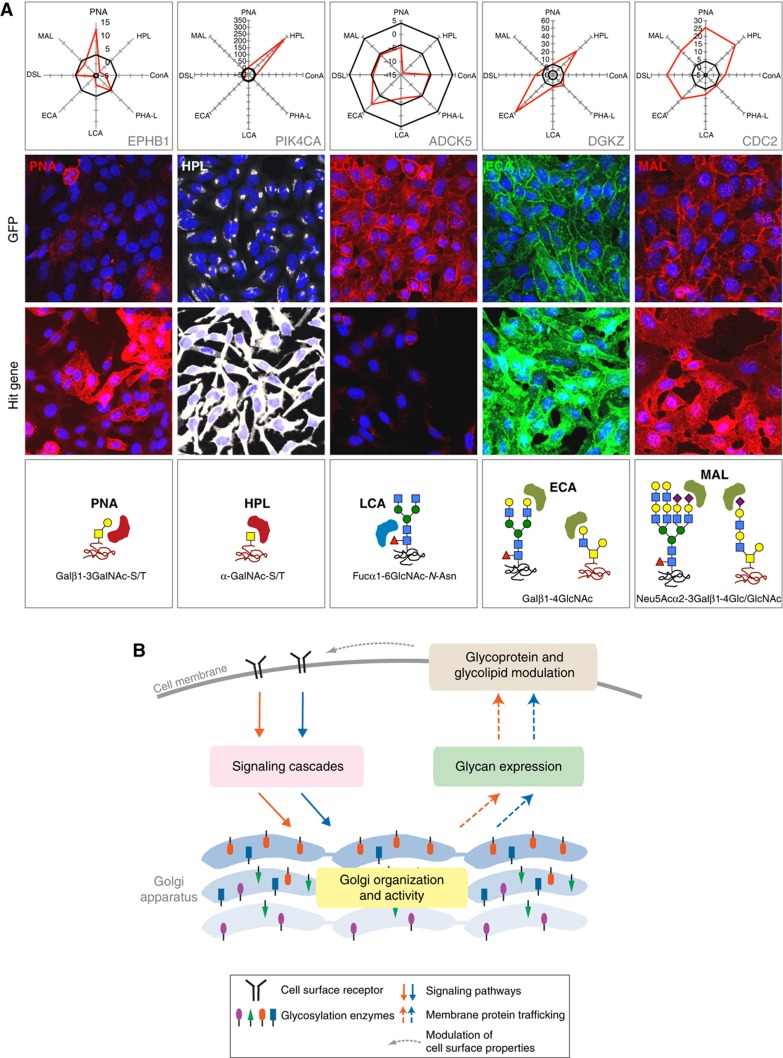
Figure 8.
Examples of signaling proteins regulating glycans expression. (A) Lectin staining and glycan profiles of representative hit genes. Top: Glycan profiles of respective hit genes. Axis values indicate normalized lectin signals. Solid lines delineate the cutoff values (4 and −4). Middle: Lectin staining of cells transfected with control GFP and hit gene siRNAs. Bottom: Main glycan structures recognized by the respective indicated lectins. (B) Model of Golgi organization and glycosylation regulation. Colored shapes populating the Golgi illustrate the variety of glycosylation enzymes.

