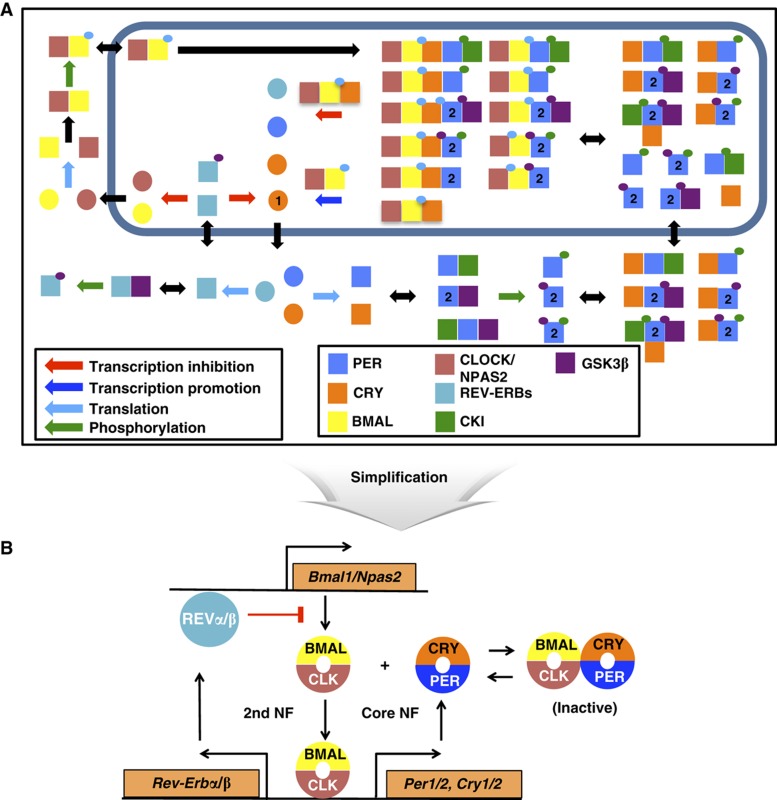
Figure 1.
Schematic of the detailed mammalian circadian clock model. (A) Only some of the relevant species are shown. Circles refer to transcripts and squares are proteins, possibly in complex. Small circles refer to phosphorylation states that are color coded by the kinases that perform the phosphorylation. See section ‘Description of the detailed model’ in Supplementary information for details. (B) The detailed model consists of a core negative feedback loop and an additional negative feedback loop (the NNF structure). The repressors (PER1–2 and CRY1–2) inactivate the activators (BMALs and CLOCK/NPAS2) of their own transcription expression through the core negative feedback loop. The activators inactivate their own transcription expression by inducing the Rev-erbs through the secondary negative feedback loop.

