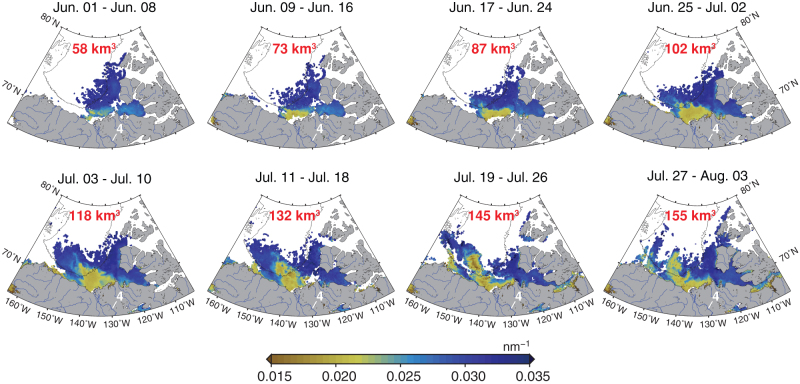
Figure 3. Temporal sequence of the Mackenzie River freshet release into the Canada Basin during June and July 2008.
The S275–295 algorithm was implemented using 4-km resolution, 8-day-binned, MODIS Aqua ocean color acquired between June 1 and August 3. The discharge value (km3) displayed on each panel indicates the cumulative Mackenzie River discharge released between May 1 (start of the freshet) and the end of each 8-day period. The contour line represents the 2000-m isobath and delineates the Canada Basin. The Mackenzie River is labeled (4).

