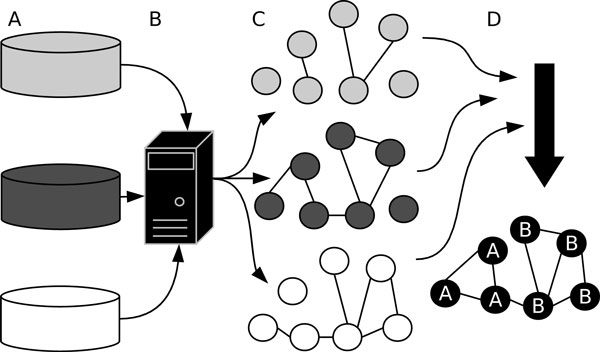
Figure 1.
Conceptual diagram of analysis pipeline. In this example, information is combined to partition seven genes. A Input gene-gene relationships are gathered from databases or via other approaches, like experimentation. B A web server is used to store, organize and provide programmatic access to the data. C Given a gene list of interest, graphs are constructed with connections among the genes representing gene-gene information for a given information source. D Graph edge weights are transformed into kernel space using gene-gene distances. The affinity-weighted graphs are combined into a summarizing graph and subsequently the summarizing affinities are projected into eigen-decomposition space, where the genes are partitioned.

