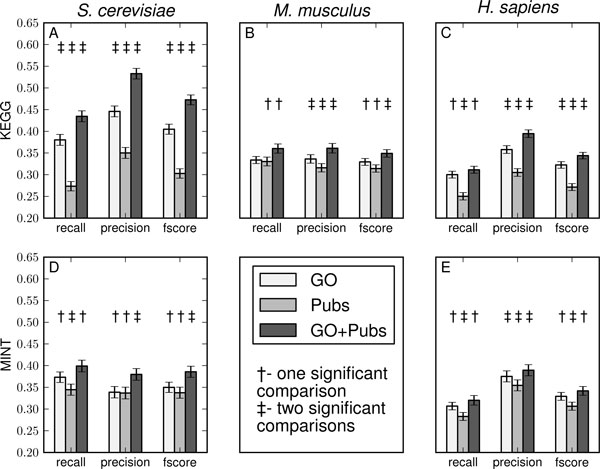
Figure 3.
Literature and Gene Ontology integration. The discriminative abilities as represented by recall, precision and F1 scores, are shown for the Gene Ontology, PubMed and combined simulations. Each subplot from left to right is a summary of 120 individual simulations for the species S. cerevisiae, M. musculus, and H. sapiens, respectively. The rows correspond to simulations run with the KEGG and MINT positive control modules. Each set of 120 simulations was comprised of a mixture of individual runs, where the number of pathways ranged from 3-8. Standard error bars are given for each discriminative measure, and for each of the three species. Significance was tested for across the data source combinations for each evaluator independently.

