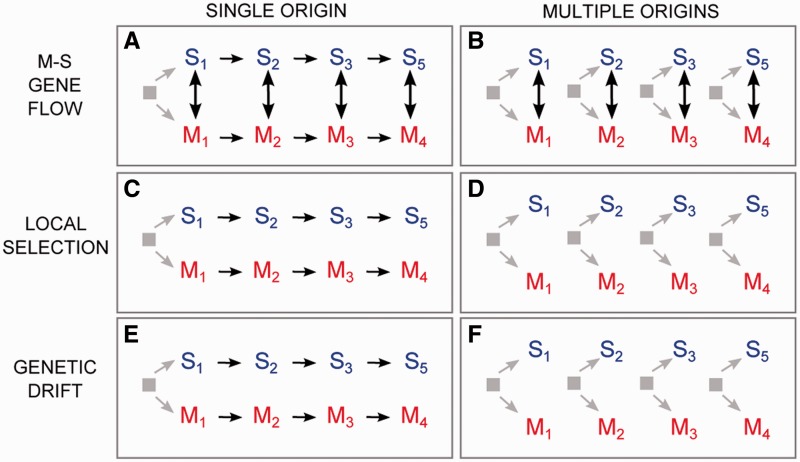
Fig. 4.—
Alternative scenarios that could explain the clustering of M and S populations by geographic proximity rather than by form in the genetic distance tree based on synonymous SNPs from low divergence regions of the genome (fig. 3D). Note that the geographic directionality of population splitting and spreading was arbitrarily chosen and is for illustrative purposes only.

