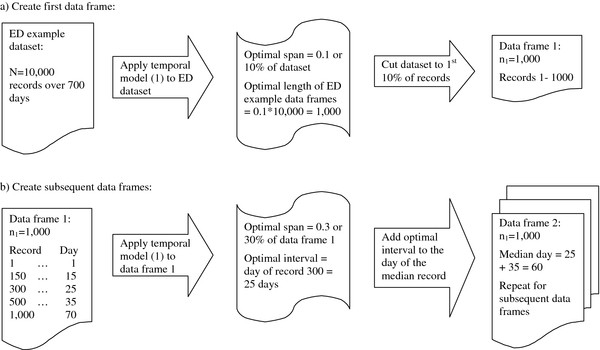
Figure 1 .

Overlapping Data Frames. The flow chart shows how data frames of overlapping time periods are created. The first step (a) is to determine the optimal length of the data frames using the optimal span of the temporal analysis for the entire ED dataset. Once the first data frame is created, the next step (b) is to use the optimal span of the temporal analysis for the first data frame to determine the optimal time interval between the median days of each data frame.
