Figure 2.
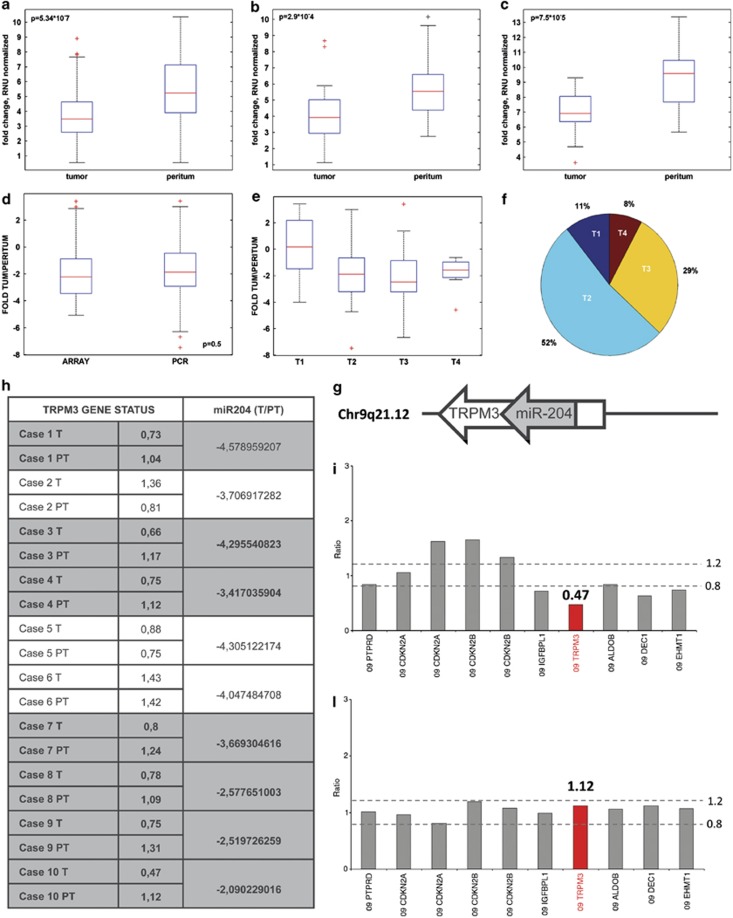
miR-204 expression correlates with tumor stage (T) data. Expression level of miR-204 in 64 RENCI paired samples, (b) in 16 SVH paired samples and (c) in 12 patients from a third independent cohort of samples SAH (S. Andrea Hospital). (d) Fold change between tumoral and peritumoral tissue on miR-204 were calculated for 111 samples (RENCI and SVH subset of patients). Fold change boxplot distribution of samples processed using different techniques and collected from different institutes indicates a similar distribution of the miR after normalization. (e) Boxplot of the comparison of T1 tumor stage versus T2, T3, T4 stage using fold change level of miR-204 signal. (f) Pie chart of tumor stage distribution of 103 known T-values (RENCI and SVH). (g) Schematic representation of the miR-204 and its host gene TRPM3. (h) Table which compares TRPM3 gene status quantitatively evaluated by multiplex ligation-dependent probe amplification with miR-204 downregulation in 10 primary GC and in the normal-matched peritumoral tissues. (i–l) Multiplex ligation-dependent probe amplification exemplificative histograms showing the heterozygous deletion of TRPM3 gene in a gastric carcinoma as compared with the matched normal peritumoral tissue (TRPM3 gene ratio in the tumor 0.47 versus 1.12 in the normal peritumoral tissue)

