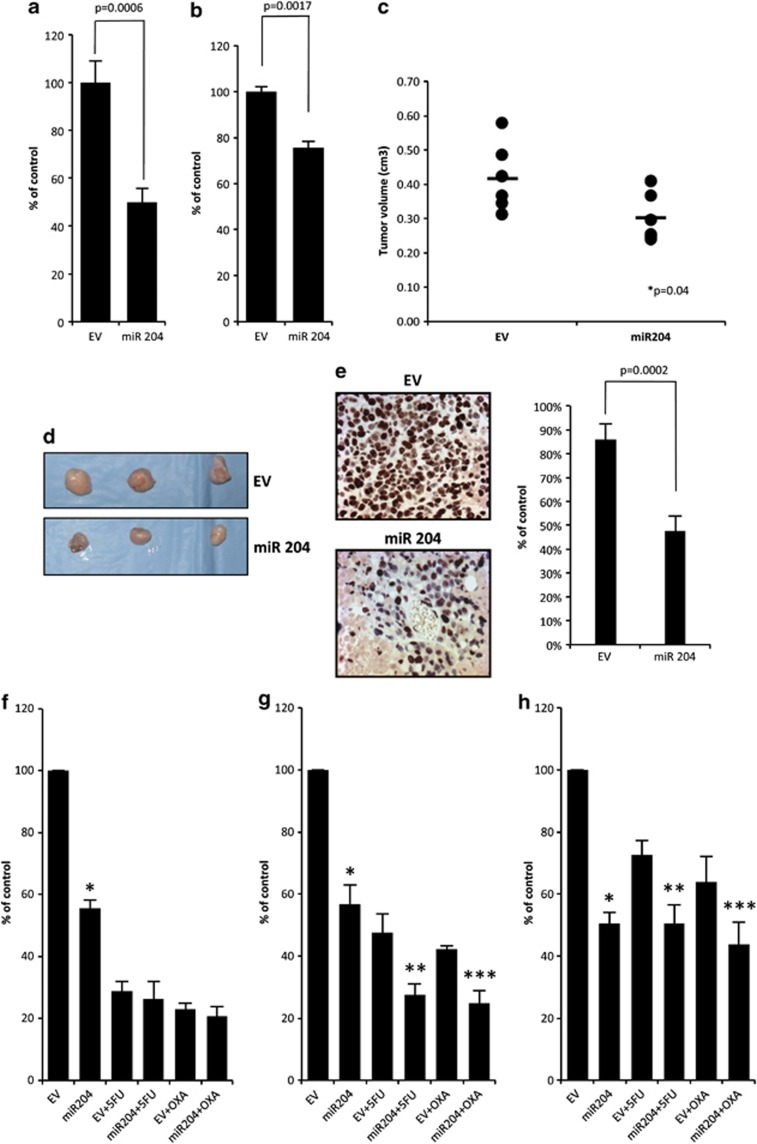
Figure 3.
miR-204 overexpression affects cell migration, colony forming ability and chemoresistance. (a) Colony assay of GTL-16 cells stably transfected with pCMV-MIR-204 (miR-204) and pCMV-MIR vector (EV). An average of three independent experiments is reported. Error bars represent mean±S.D. (b) Wound healing assay shows that miR-204 inhibits cell migration in GTL-16 cells. Quantity of migrated cells presents an average from three experiments independently. (c) Tumor volumes measured at day 28 after the first injection. The central bold lines denote mean values, the vertical lines±S.E.M. (n=6 mice in each group) and the circles data points. P-values was calculated by 2-samples t-test and indicated in the figure. (d) Images of three representative tumors from mice bearing GTL-16 stable expressing miR-204 or empty vector. (e) Left: positive immunohistochemical staining of paraffin-embedded xenografts indicates cellular proliferation of GTL-16 stable cells. miR-204 overexpressing cells show a reduced proliferation rate compared with EV. Three sections of each of the six tumors per group have been scored. ( × 400, counterstained with hematoxylin). Right: histogram shows the percentage of positive cells from 6 tumors/group. The difference between GTL-16 miR-204 and GTL-16 EV xenograft's proliferation rate is statistically significant (P=0.0002). (f–h) Colony formation assay of GTL-16 stable cells overexpressing miR-204 or the empty vector treated at decreasing concentrations of 5-fluorouracil (5-FU) or oxaliplatin (OXA) drugs. Histogram showing the average colony counts from 5-FU=6 μM, OXA=1 μg/ml (f), 5-FU=3 μM, OXA=500 ng/ml (g), 5-FU=2 mM, OXA=250 ng/ml (h). An average of three independent experiments is reported

