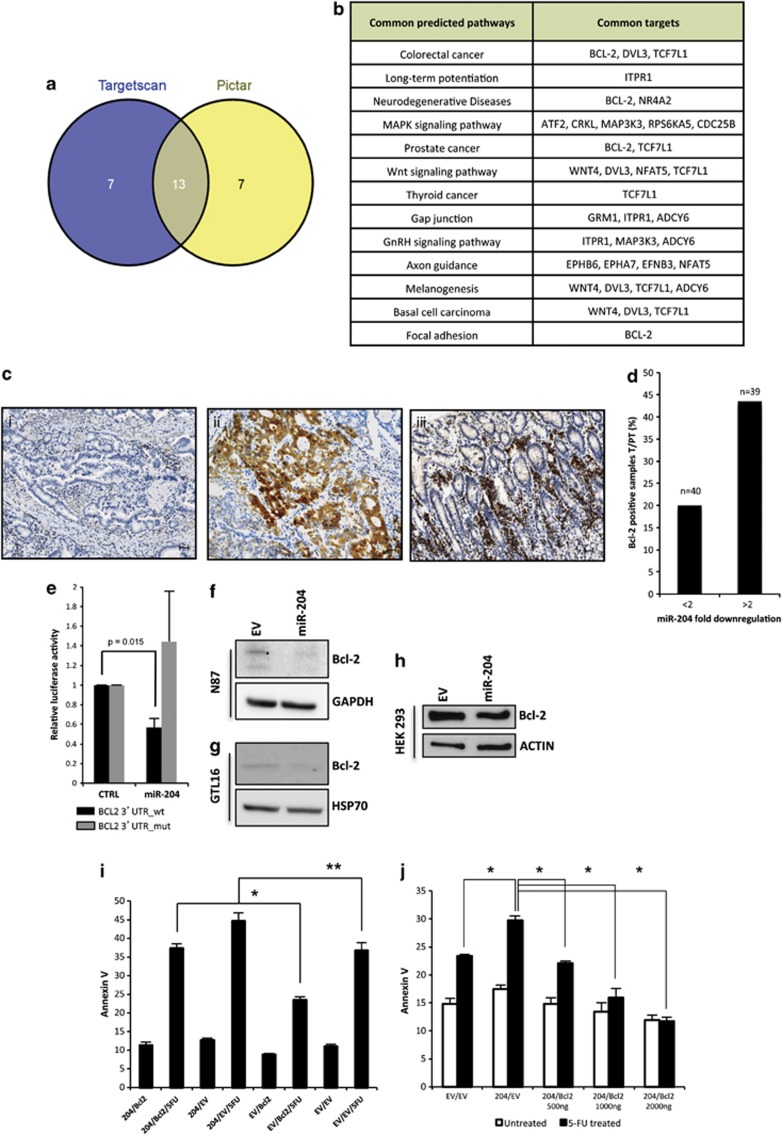
Figure 4.
miR-204 downregulates the expression of Bcl-2 protein. (a) Venn-diagramm displays 13 common pathway shared by TargetScan and Pictar. (b) Table of 13 common pathway and common targets according to TargetScan and Pictar programms. (c) Immunohistochemistry of Bcl-2 protein in representative tissue samples: a representative case of Bcl-2-negative gastric carcinoma (I), a representative case of Bcl-2-positive gastric carcinoma displays a cytoplasmic immunostaining in more than 50% of tumor cells (II), the correspondent autologous morphologically uninvolved peritumoral tissue is consistently bcl-2 negative, the internal control of infiltrating lymphocytes are positive (III). Scale bar 30 μm. (d) Percentage of Bcl-2-positive samples plotted against miR-204 fold downregulation comparing tumoral versus peritumoral samples. In x axis, it is represented the miR-204 fold downregulation, while in y axis the percentage of Bcl-2-positive samples. (e) Expression vectors carrying a luciferase reporter followed by the first 541 bp of 3′-UTR regions of Bcl-2 in their wild-type form (black bars) or mutated in the miR-204 complementary sequence (gray bars), were transfected in H1299 cells in the presence of pCMV-miR-204 or pCMV-EV. Normalized luciferase activity values from three independent experiments in triplicate are shown. (f) Immunoblotting of Bcl-2 protein in N87 cell line stably transfected either with pCMV-MIR vector (EV) or pCMV-miR-204 (miR-204). (g) Immunoblotting of Bcl-2 protein in GTL-16 cell line stably transfected either with pCMV-MIR vector (EV) or pCMV-miR-204 (miR-204). (h) Immunoblotting of Bcl-2 protein in HEK293 cells transfected with either pCMV-miR-204 or pCMV-EV and pCDNA3-Bcl-2 plasmid. (i) GTL-16 gastric cells stably expressing either miR204 or the EV and transiently transfected with Bcl-2 and the EV were stained with Annexin V. Apoptosis was determined using flow cytometry as described in Materials and Methods. The values obtained from Annexin V assays represent the means±S.D. for three independent experiments. *P=0.0008; **P=0.03. (l) 293T cells were cotransfected with miR204 and Bcl-2 and their corresponding EV, and treated with 5-fluorouracil (3 μM). Twenty-four hours after treatment, apoptosis was determined by staining with Annexin V. Histograms report the means±S.D. for three independent experiments. *P<0.005

