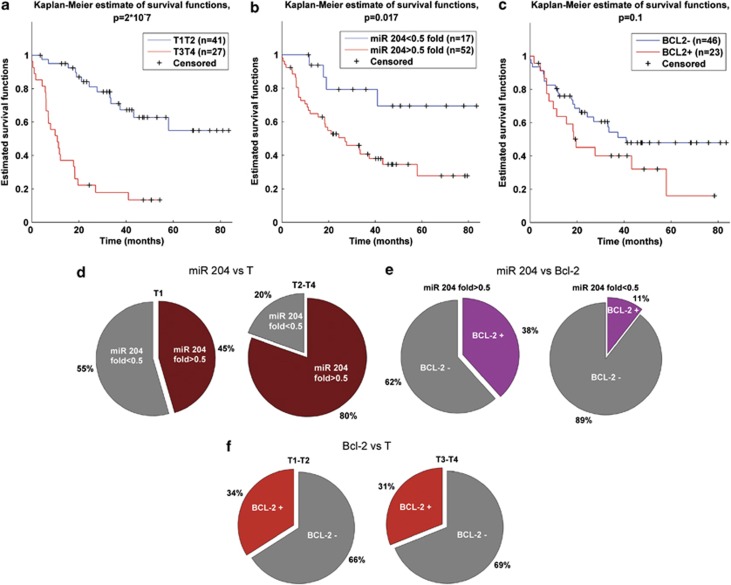
Figure 5.
(a) Kaplan–Meier survival curves of patients at stage T1–T2 versus patients at stage T3–T4. (b) Kaplan–Meier survival curves of subgroups of patients with miR-204-fold higher and lower than 0.5. (c) Kaplan–Meier survival curves of patients with Bcl-2 status positive versus negative. In all analysis the differences between estimated curves are evaluated by log-rank test. (d) Pie charts miR-204 fold distribution of 103 patients with defined T status. The distributions are calculated considering subgroups of patients at stage T1 and stage T2–T3–T4. (e) Pie charts of Bcl-2 distribution of 79 patients with defined Bcl-2 status. The distributions are calculated considering subgroups of patients with miR-204 fold higher and lower 0.5. (f) Pie charts of Bcl-2 distribution of 79 patients with defined Bcl-2 status. The distributions are calculated considering subgroups of patients at stage T1–T2 and stage T3–T4

