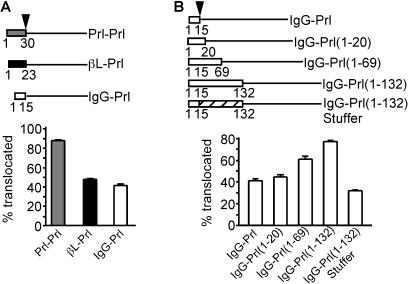
Figure 5.
Role of the ribosome–translocon junction in pPrl translocation. Above each panel is a schematic diagram of each construct. The arrowhead represents the location of signal peptide cleavage. The pPrl mature region is denoted by the solid line, and sequences from pβL and pIgG are shown by filled or open boxes, respectively. The pPrl signal sequence is shown as a gray box. The numbers below each construct represent the amino acids taken from pPrl, pβL, or pIgG. The stippled box for IgG-Prl(1–132)Stuffer represents the stuffer amino acids. The translocation efficiency was determined as the percentage of chains achieving a PK-protected, signal sequence-cleaved fate during translocation into microsomal membranes, ± SEM for three trials.

