Figure 1.
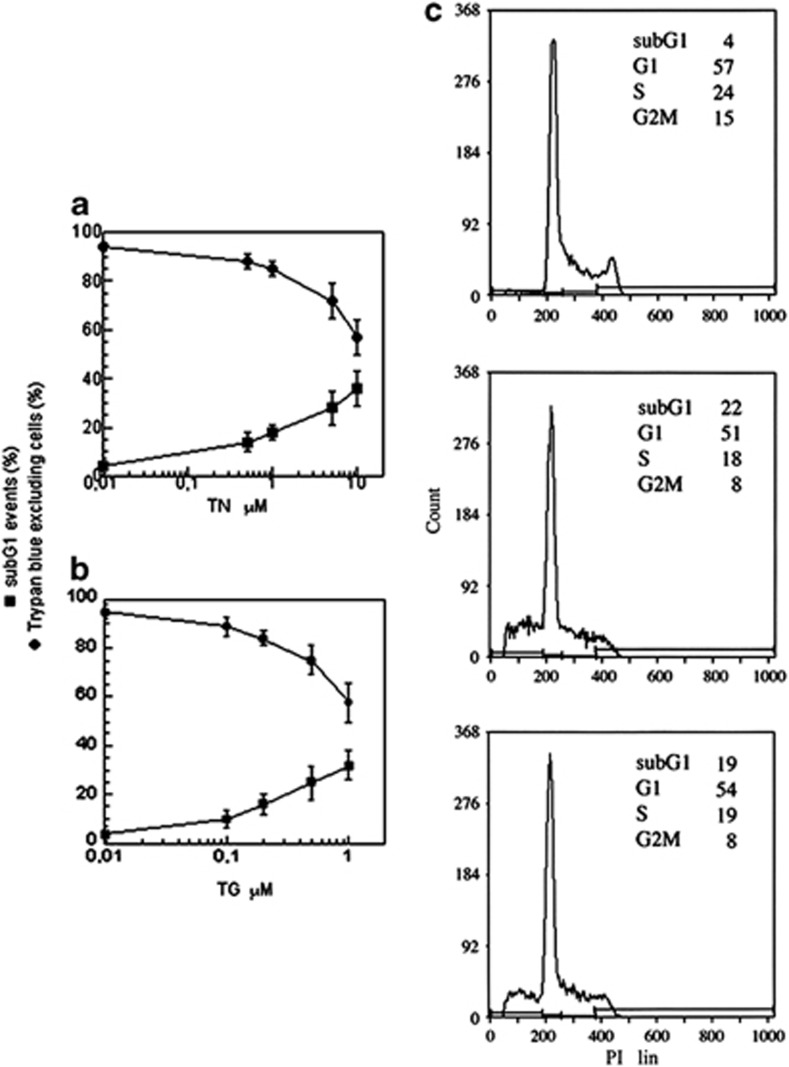
Cell survival depends on the dose of ER stressors. U937 cells were exposed or not to different concentrations of TN (a) or TG (b) for 24 h. Cells were counted in a hemocytometer as excluding and not excluding Trypan blue. Viability was obtained by calculating live (Trypan blue-excluding) cells as a percentage of all counted cells. A portion of cells were fixed and stained with propidium iodide; sub-G1 events in the cell cycle were evaluated by cytofluorimetry. The reported values represent the means and the error bars the S.D. of the percentage of live cells (Trypan blue-excluding) or sub-G1 events of 10 independent experiments. Assessment of cell survival was investigated and statistically significant differences (P<0.05) were found between the data obtained using TN 1 μM or TG 200 nM and the two highest concentrations of each drug used. (c) The cell cycle profiles of one representative experiment out of 10 performed on U937 cells untreated (upper panel) or treated with TN (1 μM) (middle panel) or with TG (200 nM) (lower panel) for 24 h. The percentage of events in the different cell cycle phases quantified in the reported experiment are indicated in each panel

