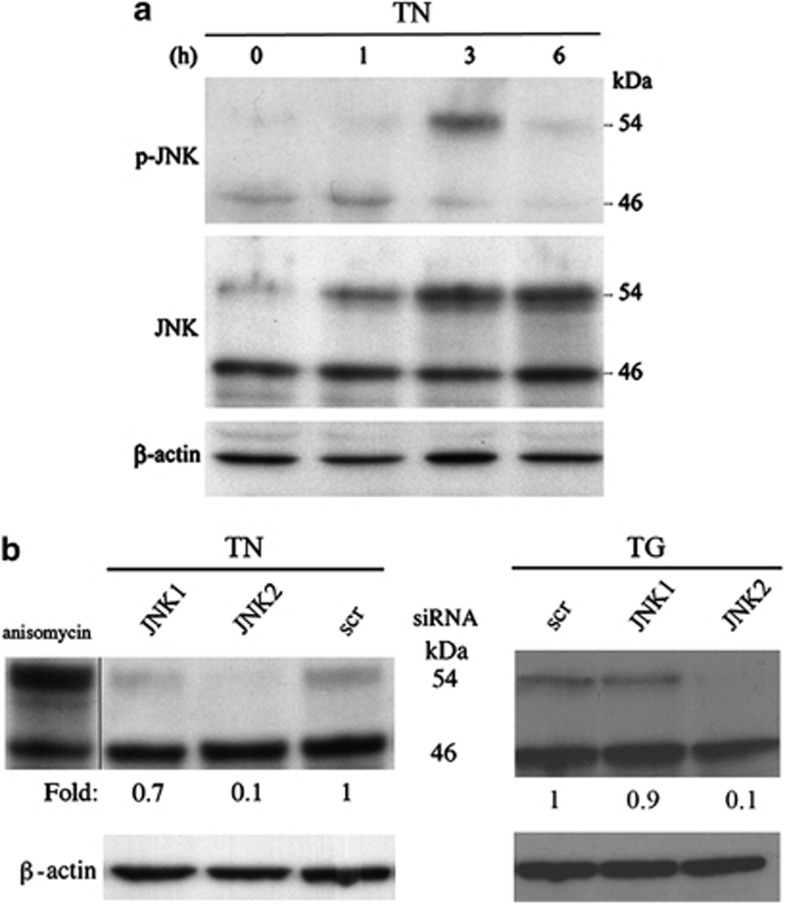
Figure 2.
TN and TG induce JNK2 migration as a 54 kDa band. (a) JNK was detected by western blot in the lysates of U937 cells either exposed to TN (1 μM) or not for the time indicated. Blotted proteins were probed with anti-phospho-JNK and then anti-JNK-antibodies, each followed by peroxidase-conjugated secondary antibody. The level of β-actin is shown at the bottom as a loading control. (b) Western blot analysis of JNK, detected by antibody recognizing JNK, in the lysates of U937 cells treated with anisomycin (5 μM × 45 min) or transfected with equal amounts of JNK1- or JNK2-siRNA or scr-siRNA for 24 h and exposed to TN (1 μM) or TG (200 nM) for a further 3 h. Western blot analysis of β-actin is shown at the bottom as a loading control and also to confirm the specificity of the transfected siRNA. Representative blots are shown. Densitometric quantification of the bands is shown at the bottom of the relevant lines as the ratio of p54 in each line to the p54 value observed in the lysate of scr-siRNA-treated cells

