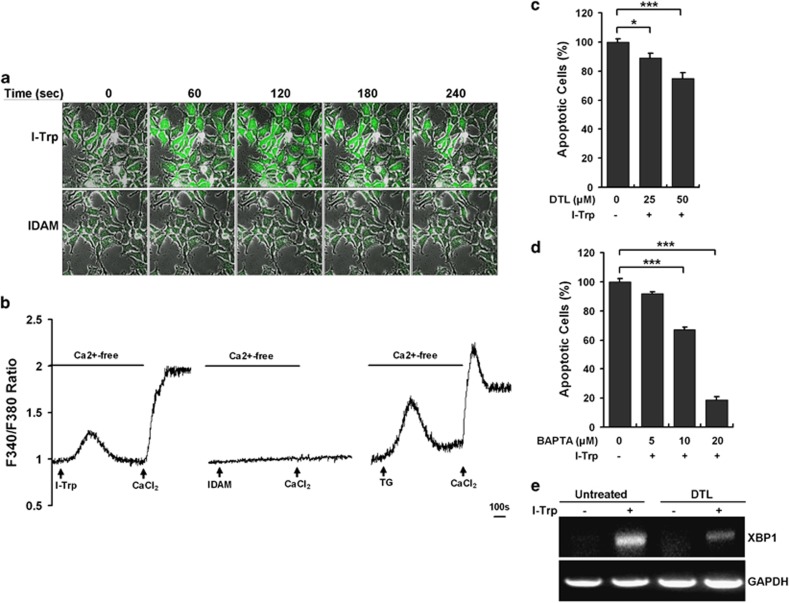
Figure 5.
The disruption of the β-tubulin:CCT-β complex using I-Trp evokes capacitative Ca2+ entry in HEK-293 cells. (a) I-Trp induces intracellular Ca2+ mobilization. HEK-293 cells were pre-incubated with Fluoro-3 (4 μM) for 30 min before the treatment with either I-Trp or IDAM (5 μM of each). The changes in the intracellular fluorescent intensities indicate the increased Ca2+ levels and were recorded every 5 s and documented as animation movies (Supplementary Movies) using a confocal microscope. The figures shown represent the alterations in the intracellular Ca2+ levels post-treatment with either I-Trp or IDAM at the indicated time courses. (b) The intracellular Ca2+ mobilization induced by I-Trp functions via the capacitative Ca2+ entry model in HEK-293 cells. The cells were pre-incubated with Fura-2-AM (5 μM) for 30 min, and the intracellular Ca2+ levels were subsequently assessed. Next, 5 μM I-Trp (right), 5 μM IDAM (middle) or 1 μM TG (left) was added (arrows) to the cells bathed in Ca2+-free focal buffer to detect intracellular Ca2+ release after starting the Ca2+ level measurements. Calcium chloride (CaCl2) (100 μM) was then added (arrows) to the external media to determine the extracellular Ca2+ influx. The changes in intracellular Ca2+ levels are presented with the ratio of Fura-2 fluorescent intensities at 510 nm emitted by dual excitation wavelengths at 340 nm (Ca2+-bound) and 380 nm (Ca2+-free). (c) The evoked intracellular Ca2+ mediates I-Trp-induced apoptosis in HEK-293 cells. The cells were pre-treated with the intracellular Ca2+ release inhibitor, DTL, at the indicated doses for 30 min before the treatment with 5 μM I-Trp. Cell apoptosis was assessed 24 h post-treatment. (d) HEK-293 cells were pre-incubated with the cell-permeable Ca2+ chelator, BAPTA, at the indicated concentrations for 30 min. Cell apoptosis was then determined 24 h after I-Trp (5 μM) treatment. (e) Cells were pre-treated without or with DTL (50 μM) for 30 min before the treatment without or with I-Trp (5 μM) for 4 h. The mRNA levels of XBP1 and glyceraldehyde 3-phosphate dehydrogenase (GAPDH) were analyzed by RT-PCR using their paired primers. GAPDH was used as an internal control. The results in (c) and (d) are the mean of three independent experiments. The values shown represent the mean±S.D. The symbol ‘*' and ‘***' denote statistical significance at P<0.05 and P<0.001, respectively

