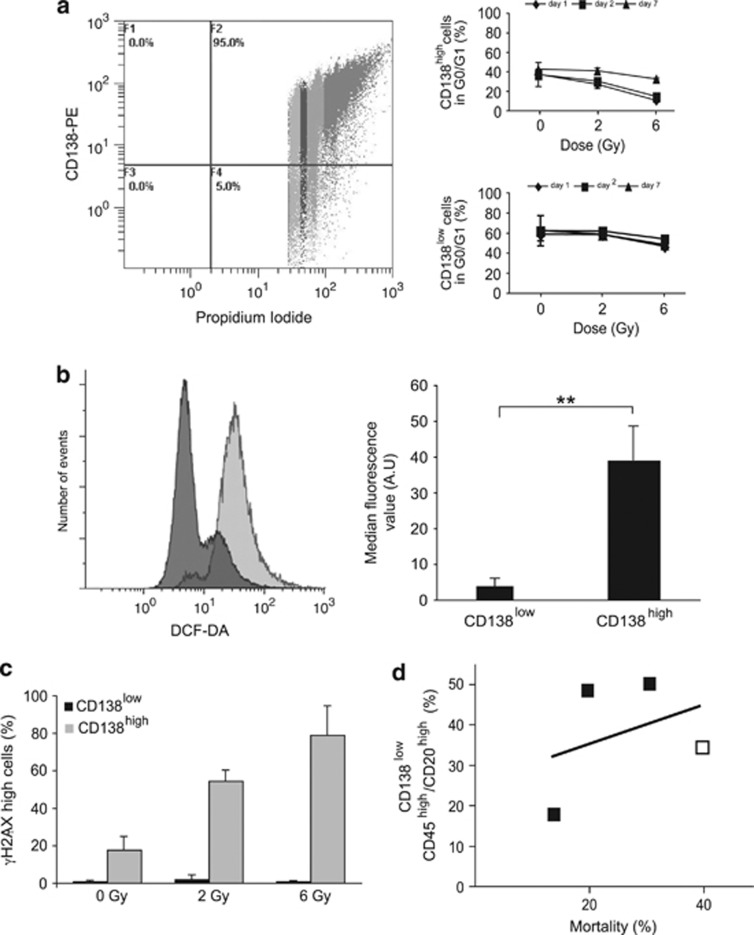
Figure 2.
Emergence of CSLCs is, in part, due to their intrinsic properties. (a) Cell cycle distribution of CD138low and CD138high RPMI 8226 cells 2 days after a 6 Gy dose of X-irradiation is illustrated on the left and the percentage of cells in G0/G1 after flow cytometry analysis on the right. (b) Intracellular ROS were detected by DCFDA staining in CD138low (dark gray) and CD138high (light gray) cells. Percentage of DCFDA-positive cells is represented on the graph (P=0.00088). (c) Irradiated (6 Gy) and control cells (0 Gy) were double-stained for CD138 and γH2AX 30 min after X-irradiation, and quantitatively analyzed by flow cytometry. (d) Percentage of mortality is plotted against the percentage of CD138low/CD45high/CD20high cells (R2=0.1358). White and black squares represent data from cells subjected to X-irradiation (6 Gy, 7 days post X-irradiation) and doxorubicin treatment (2 days post-treatment at 2.7, 13.5 and 50 nM), respectively. Data are means±S.D. from at least three independent experiments, except for (d) where squares represent the mean of two independent experiments; **P<0.001

