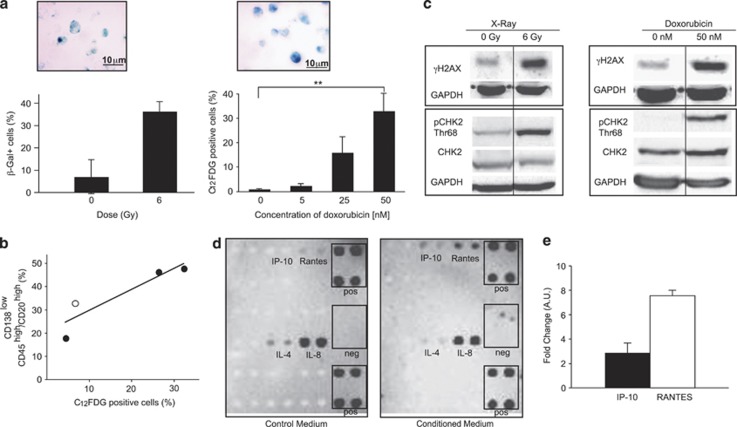
Figure 3.
Emergence of CSLCs correlates with an SASP induced by genotoxic stress. (a) RPMI 8226 were X-irradiated with a dose of 6 Gy, stained by β-galactosidase 7 days post-treatment and quantified. For each experiment, several fields were counted. Data are means±S.D. for 50 cells counted over two independent experiments (left panel). RPMI 8226 cells were treated with doxorubicin (50 nM) and stained with β-galactosidase 2 days post-treatment. Senescent cells were stained with C12FDG and quantified by flow cytometry 2 days post-treatment with doxorubicin (2.7, 13.5 and 50 nM) (P=0.00062) (right panel). (b) Percentage of senescent cells is plotted against the percentage of CD138low/CD45high/CD20high cells (R2=0.8288). White and black circles represent data from cells subjected to X-irradiation (6 Gy, 7 days post X-irradiation) and doxorubicin treatment (2 days post-treatment at 5, 25 and 50 nM), respectively. (c) Whole-cell lysates were prepared 7 days after X-irradiation with a dose of 6 Gy (left panel) or 2 days after a treatment with 50 nM doxorubicin (right panel) and analyzed by western blot with anti-γH2AX, -CHK2, -pCHK2 (Thr68) and -GAPDH (as control) antibodies. Similar results were obtained in two independent experiments. (d) A cytokine array was used to identify the cytokines and/or chemokines released into the medium by cells treated with 50 nM doxorubicin (conditioned medium). The medium of untreated cells was used as control (control medium). (e) QRT-PCR analysis of IP-10 and RANTES expressions in RPMI 8226 2 days after doxorubicin treatment (50 nM); the untreated main population served as reference. Data are means±S.D. from at least three independent experiments, except for (b) where circles represent the mean of two independent experiments; **P<0.001

