Figure 1.
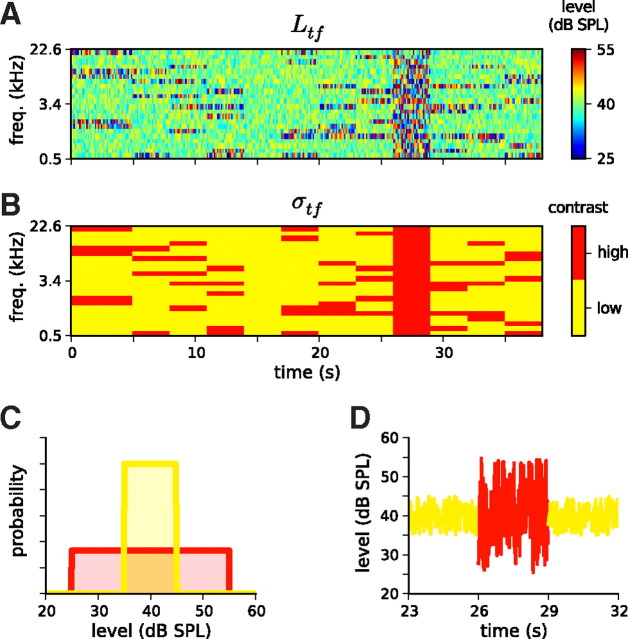
Stimuli used to estimate contrast kernels and their statistics. A, Schematic of an RC-DRC stimulus. The stimulus comprises a sequence of chords, which change every 25 ms. The elements of the chords are pure tones, whose levels are drawn from one of the distributions shown in C. The color grid shows the sound level (Ltf) of a particular tone frequency at a particular time. B, The 38 s DRC stimulus shown in A comprises 12 segments in which the contrast in different frequency bins, σtf, is either high (red) or low (yellow). C, Tone level distributions for low (yellow) and high (red) contrast segments. D, Level as a function of time for the 2.4 kHz tone over a 9 s period, i.e., a cross-section of A. This shows the transition from a segment in which the level distribution of this tone was low contrast (yellow), to a segment in which it was high contrast (red), to a third segment in which it was low contrast again (yellow).

