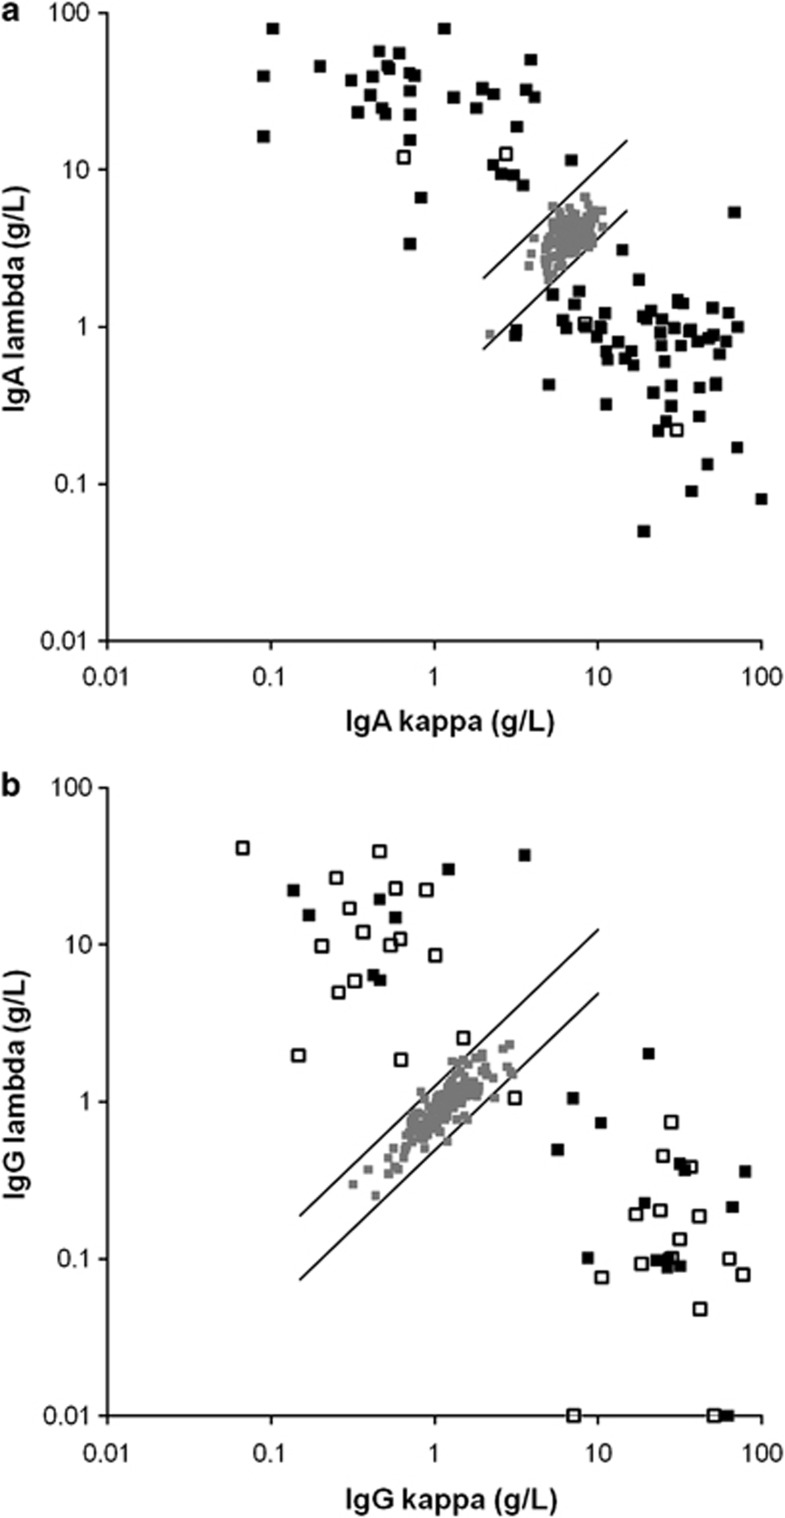
Figure 1.
Scatter graph of the HLC values. All individual values of the 100 patients with IgG (a) and of the 56 patients with IgA M-Ig (b) were outside the normal range. The solid squares denote patients with quantifiable M-Igs by SPEP, whereas open squares denote patients with anodal migration of their M-Igs, which made accurate quantification impossible.

