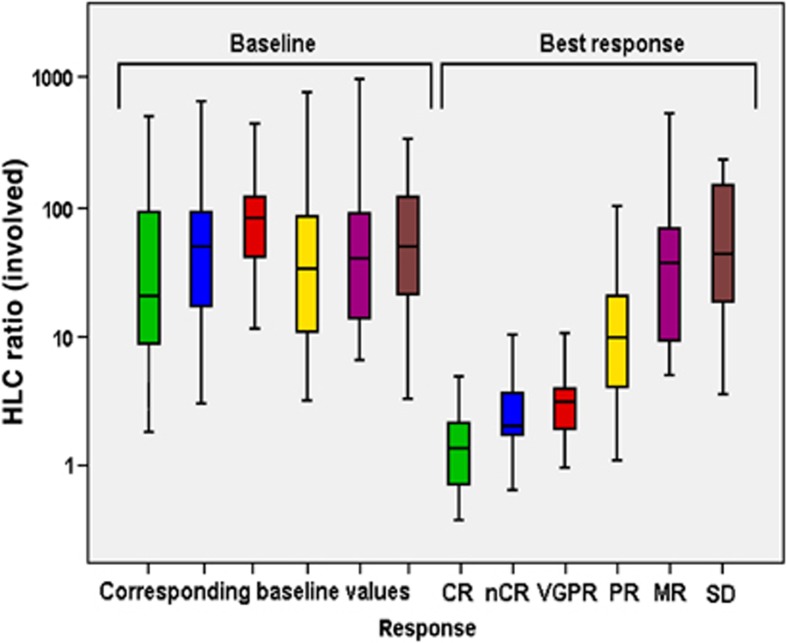
Figure 2.
Box and whisker representation of HLC ratios of the involved monoclonal immunoglobulin at baseline and maximal response for patients classified according to the IMWG and EBMT (minor response) criteria. HLC ratio at baseline did not differ between patients with different response categories.

