Figure 1.
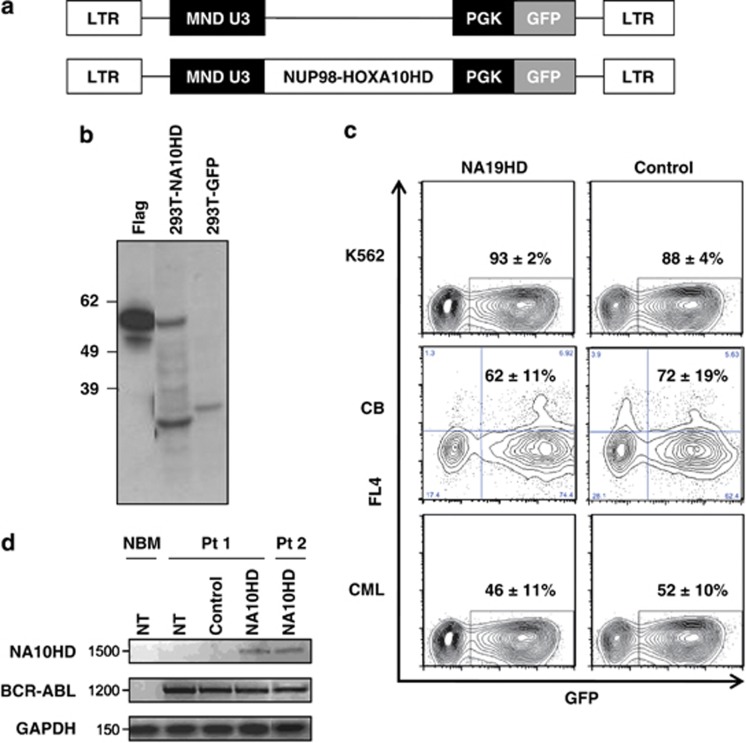
Vector validation. (a) Lenti-viruses used. The promoter region is shown in black. (b) Western blot showing flag-tagged NA10HD protein in transfected 293T cells. The expected 56 kDa size protein is present only in NA10HD-transfected 293T cells. Bands smaller than 39 kDa probably reflect cross reaction of the monoclonal ANTI-FLAG M2 antibody with naturally occurring FLAG-like epitopes in the cell lysates. Molecular weight markers (kDa) are indicated on the left. (c) Representative FACS profiles showing the gene transfer efficiency to: K562 cells measured 2 days after exposure to virus (upper panels), CD34+ CB cells assessed after their maintenance in suspension culture with GFs for 7 days after exposure to virus (middle panels) and CD34+ CP-CML cells (bottom) assessed 2 days after exposure to virus (lower panels). Values shown are mean±s.e.m. for the % CD34+ (CB) or total (K562 and CML) GFP+ cells for both constructs (n=4 for each cell type). (d) NA10HD, BCR-ABL and GAPDH transcript detection by quantitative reverse transcriptase-PCR. Values shown are mean±s.d. (n=3). GFP, green fluorescent protein; LTR, long terminal repeat; NBM, normal bone marrow CD34+ cells that had not been transduced (NT); NUP98-HOXA10HD, N-terminal region of NUCLEOPROTEIN-98 fused to the HOXA10 homeodomain (NA10HD); Pt1, transcripts in CD34+ cells from patient 1 that were NT or transduced with empty control vector (control) or transduced with NA10HD-virus and then cultured for 7 days in GF-SFM; Pt 2, transcripts in single 12-week-LTC-derived colonies initiated with NA10HD-transduced CD34+ cells from patient 2. Values shown are the mean±s.d. (n=3).

