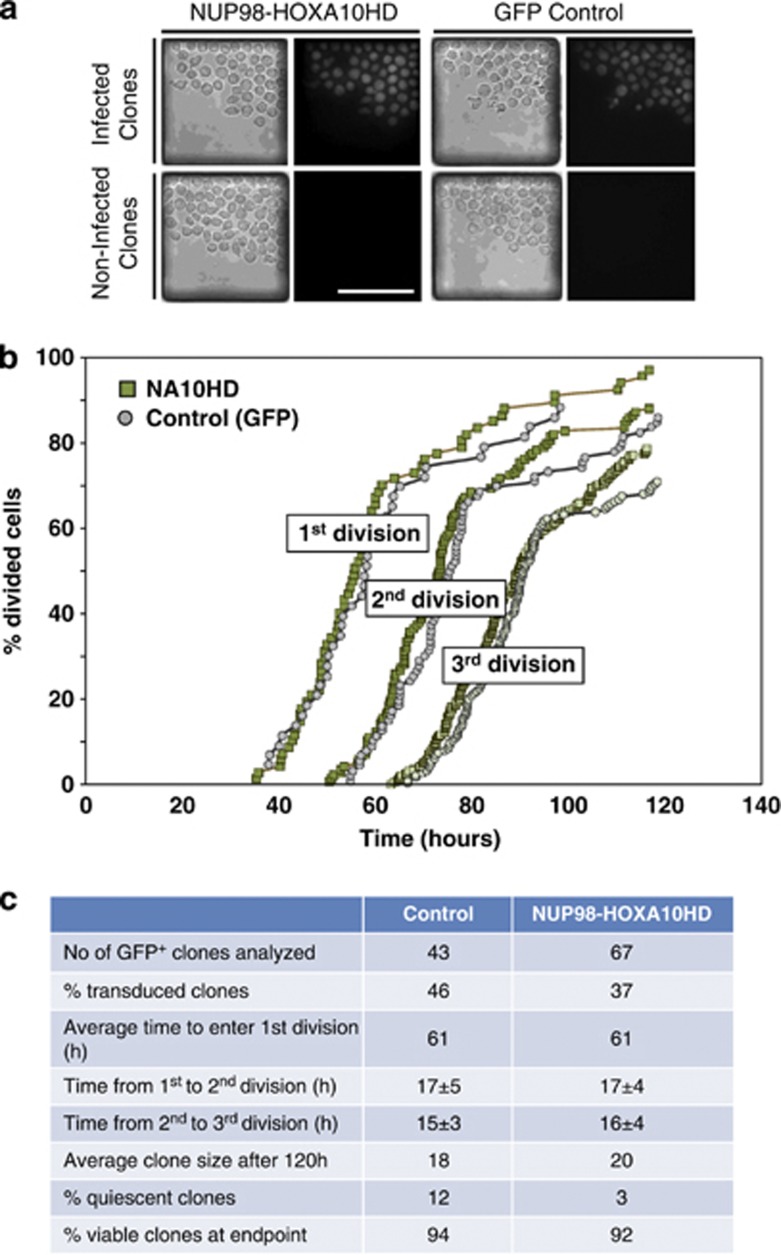
Figure 6.
NUP98-HOXA10HD does not alter the initial cell division kinetics of transduced CD34+CD38− CB cells. (a) Bright field and fluorescent photomicrographs of clones generated from single NA10HD and control-transduced CD34+CD38− CB cells after 4 days in microfluidic cultures in GF-SFM. Single cells that were successfully infected could easily be distinguished from non-expressing cells by their GFP fluorescence. Scale bar, 100 μm. (b) Comparison of the rates of cell division of individual transduced cells (clones that contained 100% GFP+ cells after 96 h of culture) when imaged every 5 min. Data are plotted as the cumulative rates of completion of one, two and three divisions over the period monitored, expressed as a percent of the number of cells/clones monitored (n=43 for control-transduced cells (grey symbols) and n=67 for NA10HD-transduced cells (green symbols). (c) Control- and NA10HD-transduced populations were loaded sequentially into the microfluidic cell culture array. A set of fluorescent images was taken at the end of the experiment to identify GFP+ clones. The % transduced clones was calculated by dividing the number of GFP+ clones by the initial number of single cells for each population. Cells were imaged every 5 min and the time of first, second and third division identified by manual inspection of the videos. The number of viable cells in each clone at the end of the experiment was counted manually. Clones were labeled as quiescent if they contained a single viable cell that had not divided during the course of the experiment. The % viability was measured by counting the number of clones, transduced or not, that contained at least one viable cell at the end of the experiment divided by the initial number of single cells for each population. Results are shown as mean±s.d.

