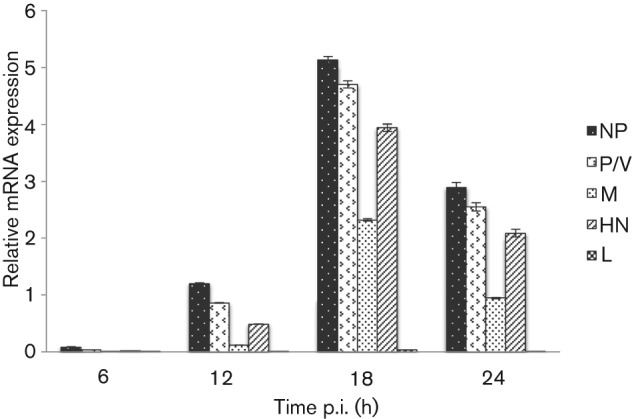
Fig. 3.

Time course of expression of CPI− mRNA. Hep2/BVDV-Npro cells were infected at a high m.o.i. (10 p.f.u. per cell) of CPI− and at various times p.i., the total cell RNA was extracted and subjected to qPCR for NP, P/V, M, HN and L mRNA. mRNA values are expressed as the quantity of the gene of interest relative to the quantity of β-actin mRNA. Results are shown as means±sem of duplicate samples in two separate experiments.
