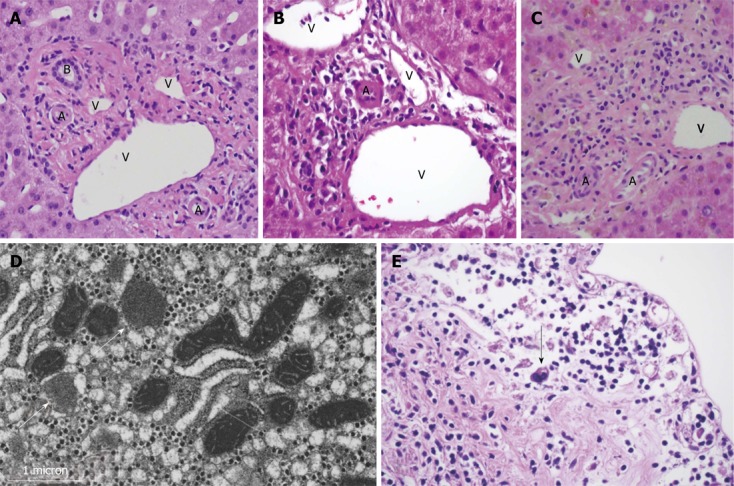
Figure 1.

Liver core biopsy. A: Portal tract from normal liver for comparison; B: Portal inflammation and absence of bile duct from the portal area from case 1; C: Portal area showing absence of bile ducts and associated infiltration of lymphocytes and plasma cells from case 2 (HE, 600 ×); D: Electron microgram, case 1. Evidence of mitochondrial toxicity was noted on electron microscopy. Some mitochondria showed loss of cristae, as well as loss of inner and outer membranes, and an amorphous appearance to the mitochondrial matrix (arrows). Similar mitochondrial changes have been described previously in cases of nucleoside reverse transcriptase inhibitor-related hepatotoxicity. Courtesy of Dr. Maria Tsokos, National Cancer Institute Laboratory of Pathology; E: Involvement of the right hepatic bile duct by Hodgkin’s Disease seen on autopsy from case 1. A Reed-Sternberg cell (arrow) is seen within the infiltrate beneath the autolysed bile duct (HE, 600×). V: Vein; A: Artery; B: Bile duct.
