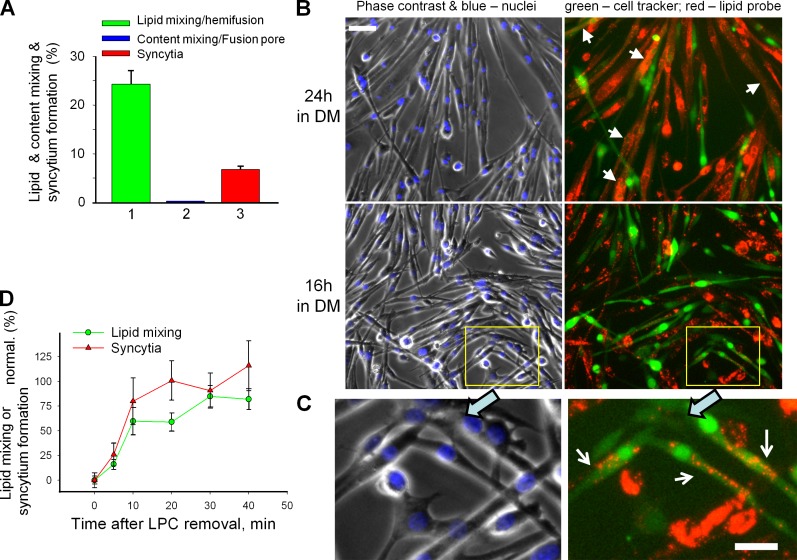
Figure 1.
Myoblast fusion proceeds via hemifusion intermediates and is reversibly blocked by hemifusion-inhibiting lipid LPC. (A–C) Fusion phenotypes observed for primary myoblasts of 12th passage after 24 h (A) and 24 or 16 h (B) in DM. (A) Percentage of mononucleated cells labeled with green cell tracker that had also acquired red fluorescence by lipid probe exchange with DiI-labeled cells (1) or in parallel experiment (2) by cell tracker exchange with orange cell tracker–labeled myoblasts that signify cytoplasmic connection. (3) Syncytium formation quantified combining the data from the experiments shown in 1 and 2. (B and C) Fluorescence microscopy images illustrating hemifusion phenotype. Left, phase contrast with nuclear staining; right, green cell tracker and DiI (red). (B) Arrows mark the colabeled multinucleated cells. Bar, 50 µm. (C) An enlargement of the marked region in B (bottom) with white arrows pointing to the mononucleated cells colabeled with membrane probe DiI (red) and green cell tracker, a hallmark of the hemifusion phenotype. Bar, 25 µm. (D) LPC inhibited C2C12 cell fusion and concentrated the fusion events that would normally develop within 16 h to develop mostly within 30 min after LPC removal. Curves show time courses of increase in the extents of lipid mixing (green circles) and syncytium formation (red triangles) after LPC removal at t = 0 normalized to those observed in the control experiments in which both application of LPC at t = −16 h and its removal at t = 0 were omitted. All results are shown as means ± SEM (n ≥ 3).

