Figure 2.
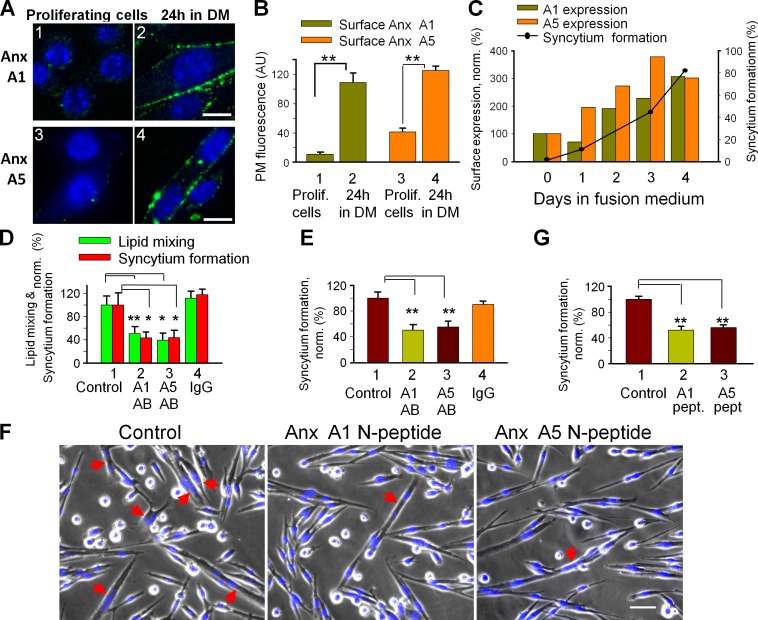
Myotube formation involves extracellular Anx A1 and A5. (A and B) Myogenic differentiation of primary myoblasts boosts surface concentration of Anx A1 and A5. Anx A1 (1 and 2) and A5 (3 and 4) were detected by immunofluorescence microscopy in nonpermeabilized proliferating cells (1 and 3) and the cells that were incubated in DM for 24 h (2 and 4). Bars, 10 µm. (B) Cell surface fluorescence was quantified for 16 cells for each condition and presented as mean ± SEM. (C) The time course of syncytium formation by C2C12 cells correlates with a rise in the surface concentration of Anx A1 and A5. Anx concentrations are normalized to those at day 0 (at the time of placing the cells in DM). The data shown are from a single representative experiment out of three repeats. For the experiment shown, each point and bar is based on analysis of 10 randomly chosen fields of view. (D and E) Antibodies to A1 and A5 (2 and 3, respectively) inhibit lipid mixing and syncytium formation (D) for C2C12 myoblasts at 67 h in DM and syncytium formation for primary myoblasts at 24 h in DM (E). Control experiments with no antibodies applied (1) or with nonspecific IgG (4) are shown. (F and G) A1- and A5-peptides inhibit syncytium formation by primary myoblasts at 24 h in DM. (F) Phase contrast with nuclear staining (blue) images of the cells incubated or not with either A1- or A5-peptides. Bar, 50 µm. Arrows mark the multinucleated cells. (D, E, and G) Lipid mixing and syncytium formation extents are normalized to those in the control experiments (1). All results are means ± SEM (n ≥ 3). Levels of significance relative to controls (1): **, P < 0.01; *, P < 0.05.

