Figure 8.
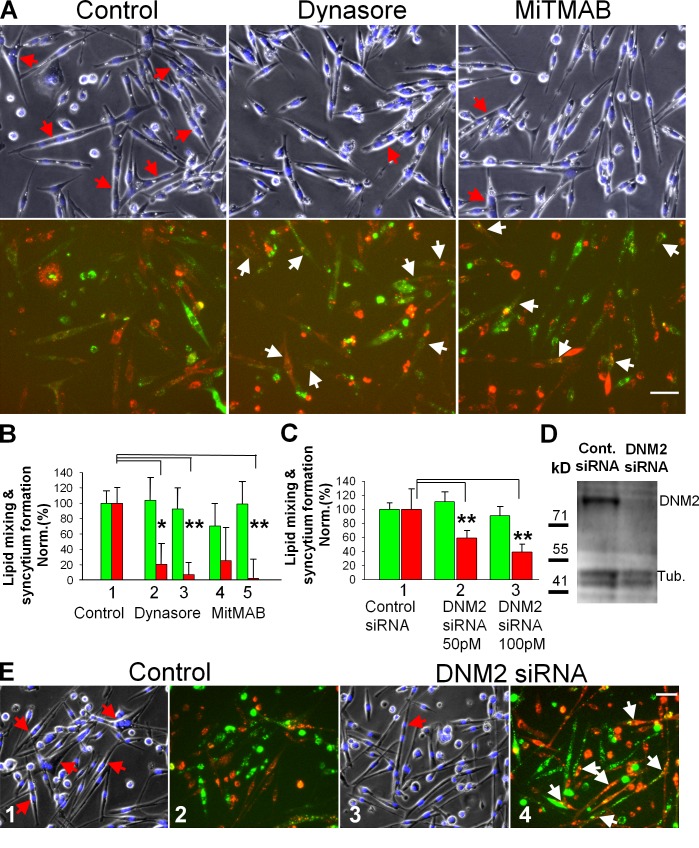
In contrast to lipid mixing, syncytium formation by primary myoblasts depends on DNM activity. (A and B) After incubation for 16 h in LPC, cells were washed to remove LPC block to cell fusion and then treated immediately with vehicle (DMSO) as a control or with DNM inhibitors (100 µM dynasore or 10 µM MitMAB). (A) Images of the cells treated with either dynasore (middle) or MitMAB (right) and vehicle-treated cells (left) were taken 30 min after LPC removal. (top) Phase contrast with nuclear staining; red arrows mark the multinucleated cells. (bottom) DiI (red) and green cell tracker; white arrows mark the colabeled mononucleated cells. Bar, 50 µm. (B) 50 and 100 µM dynasore (2 and 3) and 2.5 and 10 µM MitMAB (4 and 5) inhibit syncytium formation (red) but do not inhibit lipid mixing (green). Fusion extents were normalized to those for the vehicle-treated cells released from LPC block (1). (C) Syncytium formation (red) and lipid mixing (green) for myoblasts transfected with control siRNA (1), with 50 (2), and with 100 (3) pM of DNM2 siRNA. Fusion extents were assayed after 40 h in DM and normalized to those for the cells transfected with control siRNA (1). (B and C) All results are shown as means ± SEM (n ≥ 3). Levels of significance relative to controls (1) are shown: **, P < 0.01; *, P < 0.05. (D) The cells transfected with control or DNM2 siRNAs were lysed after 40 h in DM and analyzed by Western blotting to evaluate levels of expression of DNM2 and tubulin (a loading control). (E) Images of the cells transfected with 100 pM of the control siRNA (1 and 2) and DNM2 siRNA (3 and 4). Images were taken after 40 h in DM. Images 1 and 3 show phase contrast with nuclear staining (blue) and images 2 and 4 show DiI (red) and green cell tracker. Red arrows (1 and 3) and white arrows (4) mark the multinucleated cells and colabeled mononucleated cells, respectively. Bar, 50 µm.

