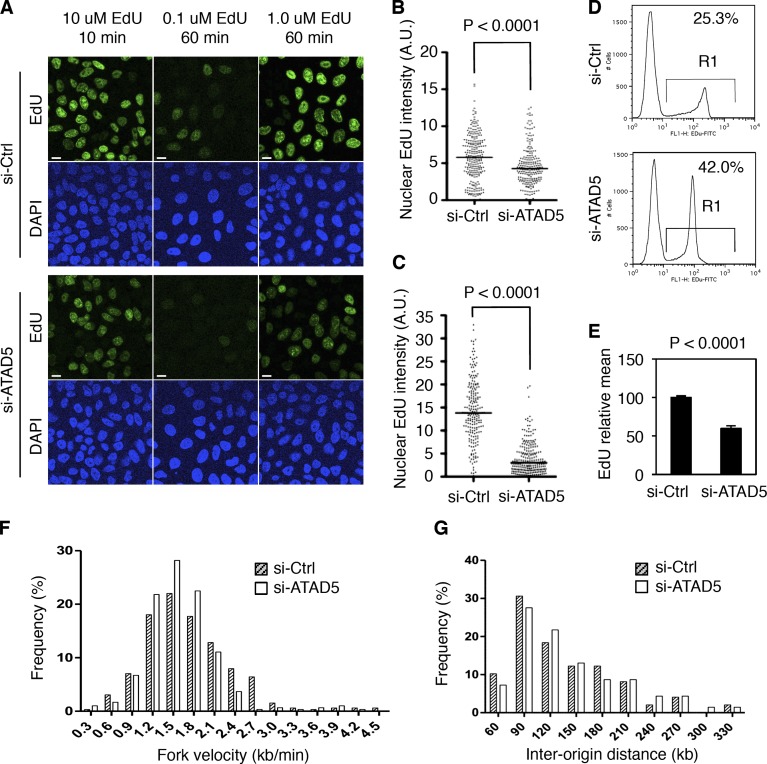
Figure 7.
ATAD5 knockdown slows DNA replication rate. In all experiments, HeLa cells were analyzed 72 h after transfection of ATAD5 or control siRNAs. (A) Cells were pulse-labeled with EdU as indicated and fixed for microscopic analysis. Bars, 10 µm. (B and C) Box blots showing the quantitation of nuclear EdU intensity. n > 200 in each condition from a single experiment; 10 µM EdU for 10 min (B), 1 µM EdU for 1 h (C). A.U., arbitrary unit; Bar in the graph, median value. (D) Cells were pulse-labeled with 10 µM EdU for 1 h, fixed, and permeabilized for flow cytometry analysis. The data shown are from a single representative experiment out of three repeats. Numbers are the mean percentage of EdU-positive cells (R1). (E) The EdU geometric mean intensity of R1 area in D was obtained from three independent experiments and mean values were calculated. Error bars indicate SD. (F and G) Cells were subjected to the DNA combing assay. The data shown are from a single representative experiment out of three repeats. (F) The distribution of the replication fork velocity was calculated (n = 298 for si-Ctrl cells; n = 327 for si-ATAD5 cells). (G) The distribution of the inter-origin distances was determined by measuring the distance between two identified replication initiation origins. P, significance by t test.

