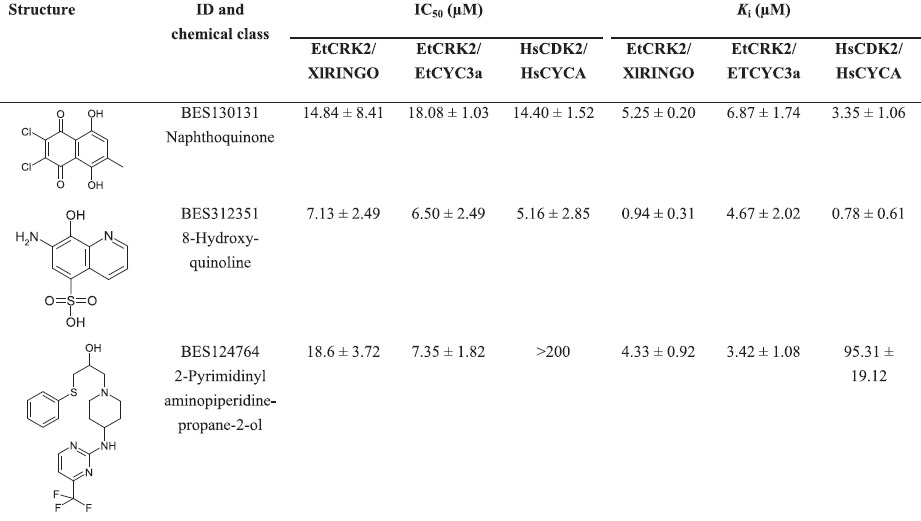
Table 3. Comparison of IC50 and Ki values of the lead structures (most active representatives of the three clusters).
Results are expressed as mean values±sd of at least three independent experiments (n = 3–6).

Results are expressed as mean values±sd of at least three independent experiments (n = 3–6).
