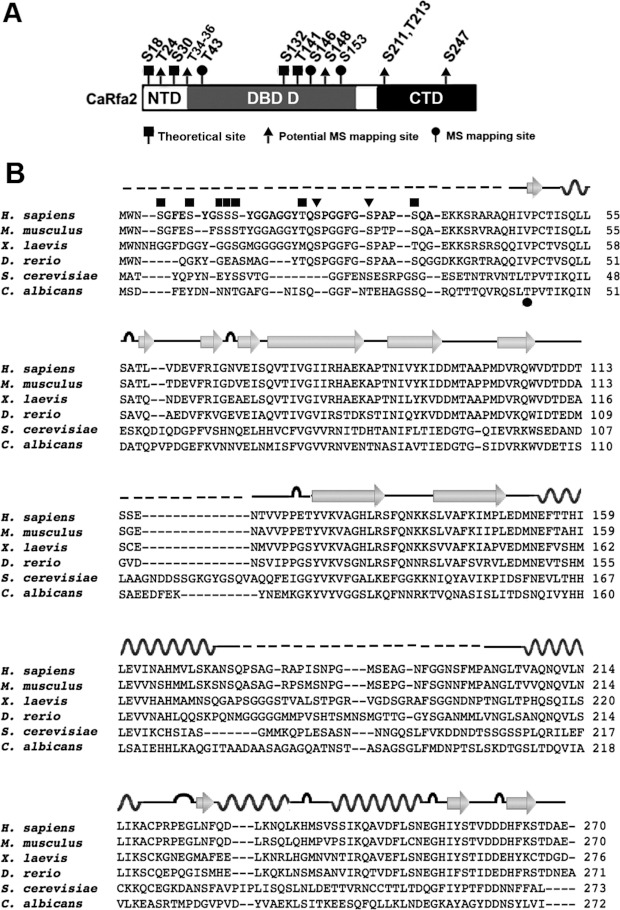
Figure 6. Potential dephosphoryation sites on Rfa2 mediated by Pph3 during normal growth.
(A) Domain structure of Rfa2 depicting potential dephosphorylation sites mediated by Pph3. Rfa2 extracted from pph3Δ (HT2) cells was subject to MS analysis to map potential dephosphorylation sites mediated by Pph3 during normal growth phase. A black square denotes theoretical phosphorylation sites listed on the Uniprot database; a black triangle denotes phosphorylated sites mapped by MS with medium-high probability; and a black circle denotes phosphorylated sites mapped by MS with high probability. (B) Sequence alignment of Rfa2 and homologues in Homo sapiens, Mus musculus, Xenopus laevis, Danio rerio, S. cerevisiae and C. albicans. The secondary structure of human RPA2 (PDB codes 2PQA and 1Z1D) is illustrated above the sequence, where wave lines denotes α-helix, arrows denote β-strand, loops denote turns and broken lines denote unstructured regions. Black squares denote empirical DNA-PK and PI3K phosphorylation sites on human RPA2; black triangles denote CDK phosphorylation sites on human RPA2; and the black circle denotes the phospho-threonine mapped on C. albicans Rfa2 in the present study.

