
FIG. 2.
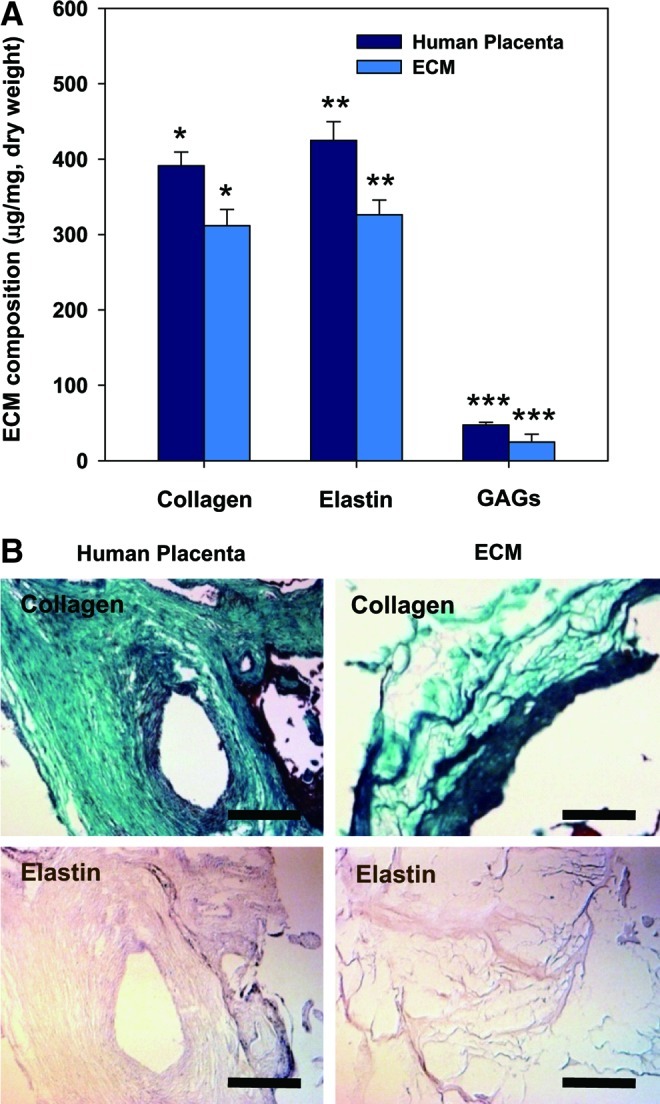
(A) Biochemical analysis of ECM components, including acid/pepsin-soluble collagen, sulfated GAG and soluble elastin. All samples were normalized to ECM or placenta dry weight. Data are shown as mean±standard deviation (n=5) with significance at *, **, ***p<0.05 between the human placenta and ECM. (B) ECM compositions before and after decellularization were identified using Gomori's trichrome staining (collagen, green) and orcinol-new fuchsin staining (elastin, light purple). Scale bars represent 200 μm. GAG, glycosaminoglycans. Color images available online at www.liebertpub.com/tea