Figure 3.

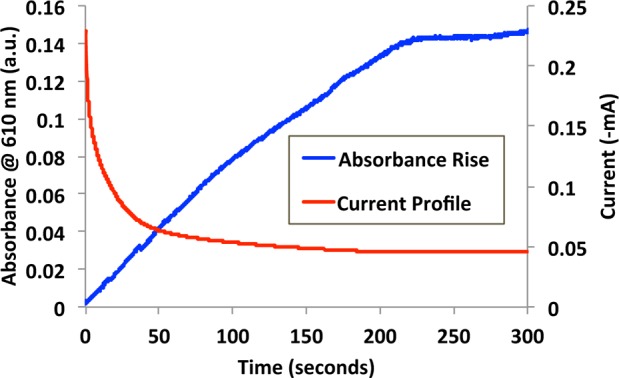
(Blue) Coloration response curve obtained for platform I (−0.84 V) and the current profile within the platform during coloration (red).

(Blue) Coloration response curve obtained for platform I (−0.84 V) and the current profile within the platform during coloration (red).