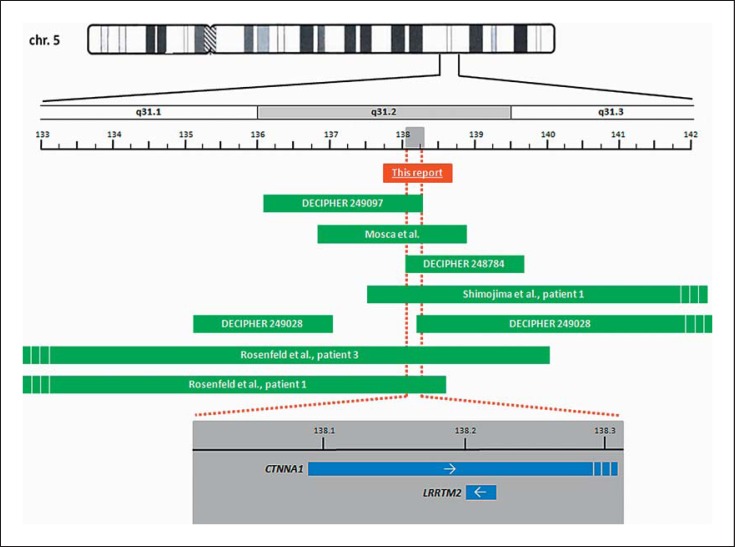
Fig. 2.
Schematic representation of the 5q31.1q31.3 deletions. The dashed red line defines the smallest region of overlap (SRO) of the 6 deletions which are not accompanied by additional relevant imbalances. The grey box represents a magnification of the SRO. Genes within the SRO are depicted by blue bars with the arrows indicating transcription direction. Dashed bars: genes/deletions extend further. All positions are according to assembly GRCh36.

