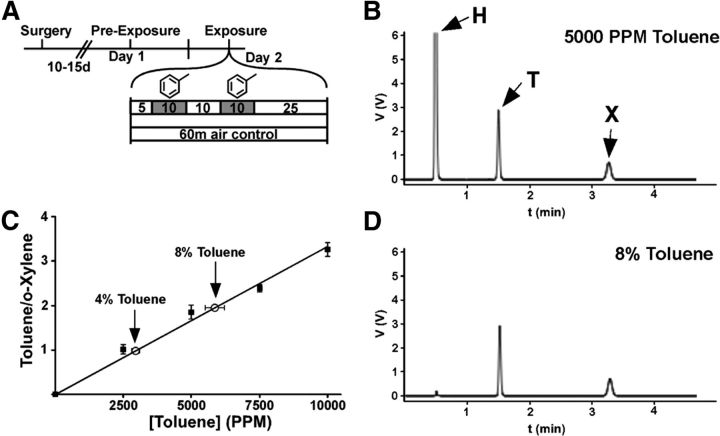
Figure 1.
Analysis of toluene vapor concentration by gas chromatography. A, Schematic of experimental design. Toluene exposures are marked by the gray boxes. B, Sample chromatogram from 5000 PPM. H, Hexane; T, toluene; X, o-xylene. C, Standard curve showing the ratio of toluene and o-xylene area under the curve (r2 = 0.991; n = 5 for each). Open circles represent the measured concentrations from 4 and 8% toluene exposures in the vapor chamber (n = 5 for each). D, Representative chromatogram from an air sample from the vapor chamber when 8% toluene is flowing at a rate of 4 L/min for 10 min.

