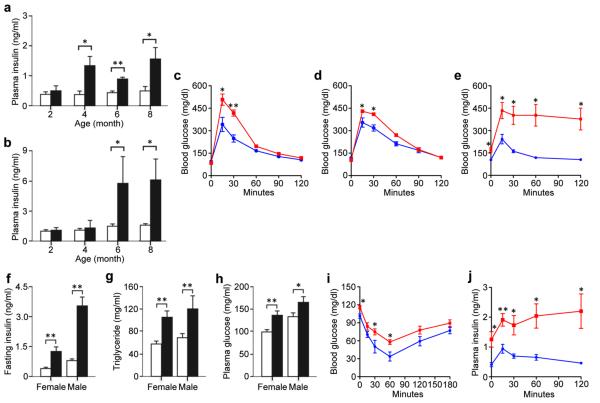
Figure 3.
Metabolic changes in Tg-mice. (a-b) Plasma insulin levels were measured in Tg (solid bar) and WT (open bar) age matched female (a) and male (b) mice (n=9). (c-d) Glucose tolerance test (GTT) were performed in Tg-mice (red line) and age-matched WT-mice (blue line) at 2 months (female: (c); male: (d), n=5 in each group). (e) GTT on female Tg-mice (red line) (n=9) and WT-mice (blue line) (n=5) at age of 8 month. (f-h) Fasting plasma insulin (f), plasma triglyceride (g) and fasting blood glucose (h) were determined for Tg-mice (solid bar) and WT-mice (open bar) at age of 8 months (female: Tg (n=10), WT (n=4); male: Tg (n=5), WT (n=4)). (i) Insulin tolerance test on female Tg-mice (red line) (n=9) and WT-mice (blue line) (n=5) at age of 8 month. (j) Plasma insulin concentration after glucose stimulation was determined using radioimmunoassay for female Tg-(red line) and WT-mice (blue line) at 8 months of age (Tg (n=9); WT (n=5)). Error bars indicate s.e.m. and significance is indicated by * (P<0.05) and ** (P<0.01) determined by Student’s t-test.

