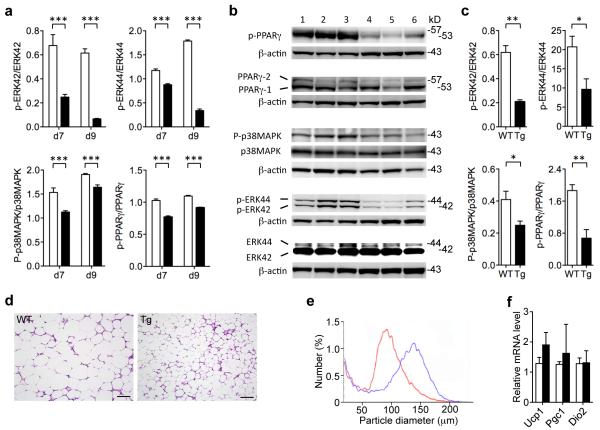
Figure 7. Epo effects in preadipocytes during differentiation and WAT from Tg-mice.
(a) Western blotting was performed on MEF cells from WT-mice (open bar) and Tg-mice (closed bar) cultured with Epo under differentiation inducing condition for 9 days. Results were quantitatively assessed for the expression and phosphorylation (p-) of ERK42, ERK44, p38MAPK and PPARγ, and presented as the ratio of phosphorylation to total expression at day 7 (d7) and 9 (d9). Data were obtained from three replicate experiments. (b-c) Western blotting (b) and quantitative analysis (c) for the expression and phosphorylation (p-) of ERK42, ERK44, p38MAPK and PPARγ were performed on WAT from WT-(open bar) (n=3) and Tg-mice (closed bar) (n=3). Results were presented as the ratio of phosphorylation to total expression. Each lane in the Western blot represents WAT harvested from a different mouse. (d) Representative H&E staining of gonadal fat pad sections from WT-mice (WT) and Tg-mice (Tg) at age of 8 month. Scale bar = μM. (e) Direct analysis of adipocyte cell size in WAT by Beckman Coulter Multisizer indicates cell size in Tg-mice (50%: 95.9 μm diameter) (red) is smaller than in WT mice (50%: 129.5 μm diameter) (blue). (f) Gene expression of mUCP1, mPGC1 and mDIO2 in brown adipose tissue from WT-mice (open bar) and Tg-mice (closed bar) (female, n=8) at age of 6 months was determined using quantitative real time RT-PCR with normalization to 18S. Error bars indicate s.e.m. and significance is indicated as * (P<0.05), **(P<0.01) and *** (P<0.001) determined by Student’s t-test.

