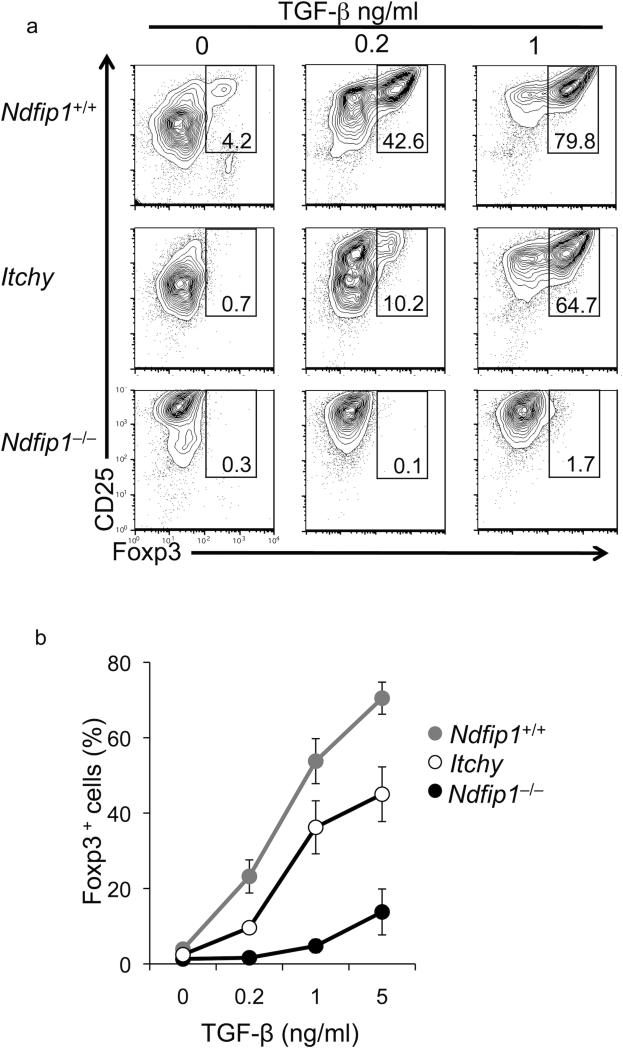
Figure 3. Both Ndfip1–/– and Itchy mutant T cells are defective in iTreg cell conversion.
(a) Naïve T cells were stimulated with various concentrations of TGF-β as described in Figure 2. After incubation, cells were analyzed for iTreg cell conversion by flow cytometry. Analyses of WT, Ndfip1–/–, and Itchy mutant T cells are shown. Data are representative of at least 6 independent experiments. (b) The mean frequency of Foxp3+ cells in the cultures of WT (gray circles), Itchy mutant (open circles), and Ndfip1–/– (black circles) cells is plotted over the indicated concentrations of TGF-β. (mean + SEM from 8-12 mice).

