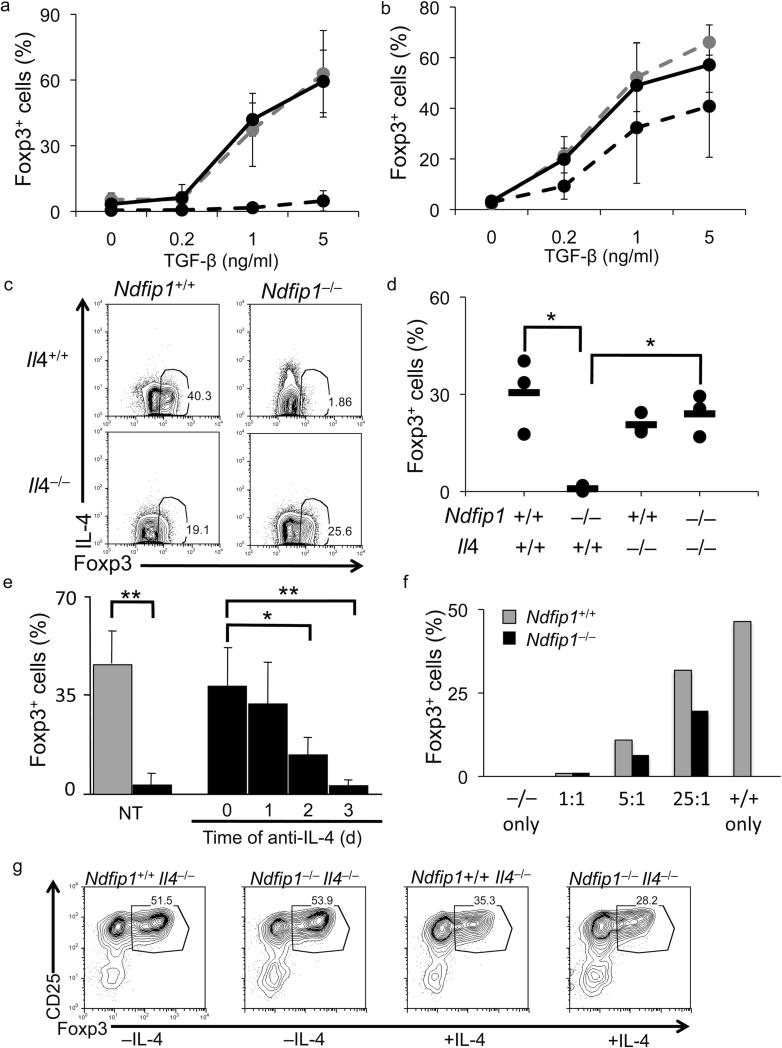
Figure 5. Depletion of IL-4 restores iTreg cell conversion in Ndfip1- and Itch-deficient T cells.
(a-g) iTreg cell conversion assays were performed in the presence of 1ng/ml TGF-β (unless otherwise noted) and Foxp3 expression was analyzed on day 5. (a and b) The percentage of Foxp3+ cells was analyzed following iTreg cell conversion with (solid black line) and without (dashed black line) anti-IL-4 using Ndfip1–/– (a) and Itchy mutant (b) T cells. Conversion of Ndfip1+/+ cells is shown (gray dashed line). (mean + s.d.; n≥4 mice; 2-4 independent experiments) (c and d) iTreg cell conversion of naïve T cells from mice of indicated genotypes. Data are representative of 3 mice of each genotype. (d) Analyses of experiments described in c are shown (dot represents each mouse; dash shows the mean). *P<0.05 (two-tailed student T-test). (e) Percentages of Foxp3+ cells were analyzed among Ndfip1+/+ (gray bar) or Ndfip1–/– (black bars) T cells cultured under iTreg cell conditions either without (NT) or with the addition of anti-IL-4 blocking antibodies at time points indicated. The percentage of Foxp3+ Ndfip1+/+ T cells did not change with addition of anti-IL-4 (not shown). Bars show the mean + s.d. at least 3 mice. *P=0.01, **P<0.005 (two-tailed student T-test). (f) Ndfip1+/+ CD45.1+ or Ndfip1–/– CD45.2+ naïve T cells were stimulated alone or in mixed cultures at the indicated ratios (Ndfip1–/–=1 at all ratios). The graph depicts one representative experiment of two. (g) Ndfip1+/+ IL4–/– or Ndfip1–/– Il4–/– T cells were differentiated into iTreg cells with or without the addition of 200pg/ml IL-4 (the half maximal inhibitory concentration of IL-4).

