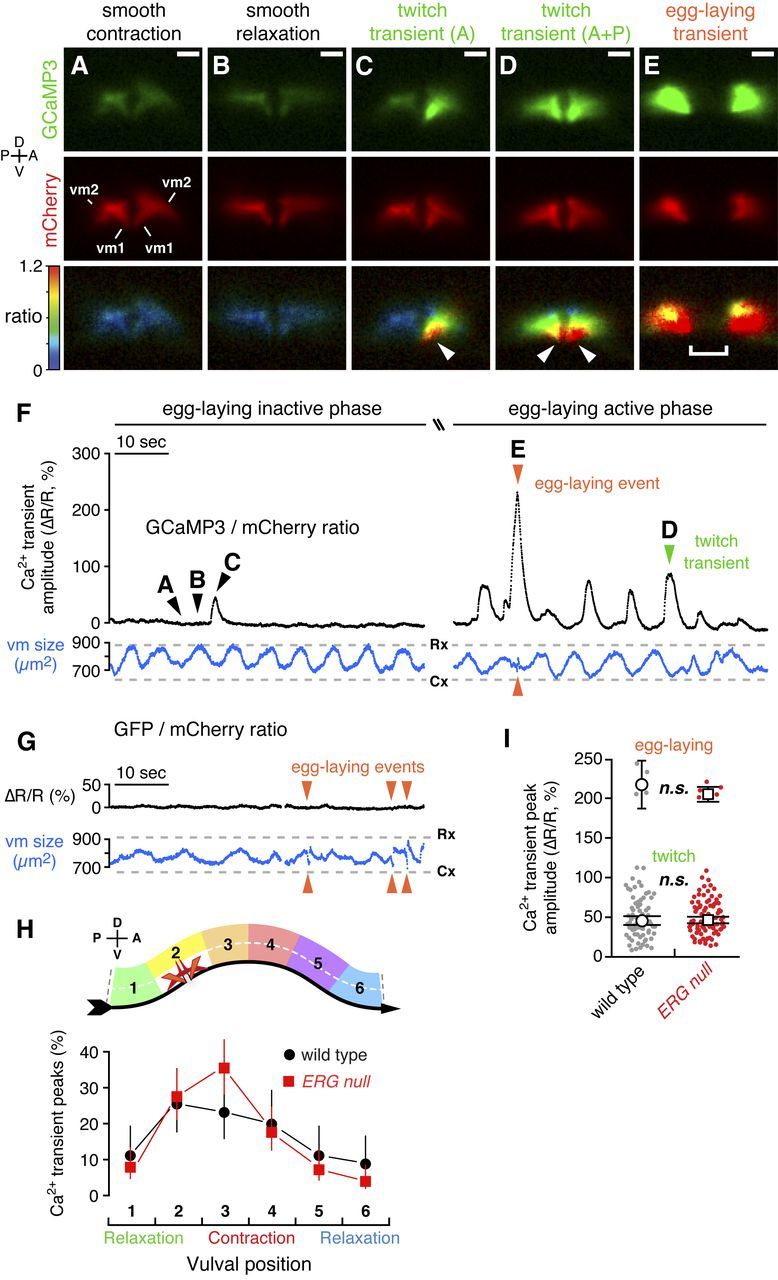
Figure 7.

Distinct vulval muscle Ca2+ transients mediate twitching and egg-laying behaviors. A–E, Ratiometric Ca2+ imaging in the vulval muscles in behaving animals. Three 1 min recordings were made for each of 10 wild-type and 10 ERG-null animals. GCaMP3 (top) and mCherry (middle) fluorescence, and the GCaMP3/mCherry intensity-modulated ratio (bottom) images from a wild-type animal are shown and correspond to the time points indicated by arrowheads labeled A–E in F. C, A twitch transient in the anterior half of the vulva. D, A twitch transient occurring in both anterior and posterior halves. Arrowheads, Subcellular localization of the GCaMP3/mCherry ratio peak at the vulval tips. Separation of the two halves of the vulva in E is due to contraction of the vulval muscles and the passage of an egg through the vulva. Scale bar, 10 μm; positions of vm1 and vm2 are indicated. See also Movies 2 and 3. F, Traces from a representative wild-type animal are shown of the average GCaMP3/mCherry ratio in the vulval muscles (ΔR/R, black trace) before (left side; Movie 2) and during the egg-laying active phase (right side; Movie 3). Traces of the area of the mCherry signal (blue) indicate changes in vulval muscle (vm) size during locomotion. Cx, smooth contraction; Rx, smooth relaxation. Arrowheads indicate Ca2+ transients that mediate egg-laying and twitching contractions. G, Ratiometric imaging in the vulval muscles in behaving animals expressing the Ca2+-insensitive GFP along with mCherry. Egg-laying contractions (arrowheads) appear as events in the vulval muscle size trace (blue) but are silent in the GFP/mCherry ratio. H, Vulval muscle Ca2+ transients are phased with locomotion. Six minute recordings were made for each of six wild-type and ERG-null animals. The peak of each Ca2+ transient was mapped relative to the timing of vulval muscle smooth contractions and relaxations (top) as the animal moves to its anterior on right (ventral arrow). Points indicate the proportion of transients that occurred at each position (wild type: black circles, n = 90 transients; ERG-null mutants: red squares, n = 152 transients). I, Peak GCaMP3/mCherry ratio (ΔR/R) amplitudes for Ca2+ transients recorded from three 1 min recordings from each of 10 wild-type and 10 ERG-null animals are shown in a scatter plot (gray, n = 85 wild-type transients; red, n = 102 ERG-null mutant transients). Transients were grouped by peak ΔR/R amplitude into egg-laying (>120%) and twitch (0–120%) transients. Open circles (wild type) and squares (ERG null) indicate the mean amplitude for each group; n.s., not significant (p > 0.05; t test). Error bars, 95% confidence intervals. Axes indicating anterior (A), posterior (P), dorsal (D), and ventral (V) are shown.
