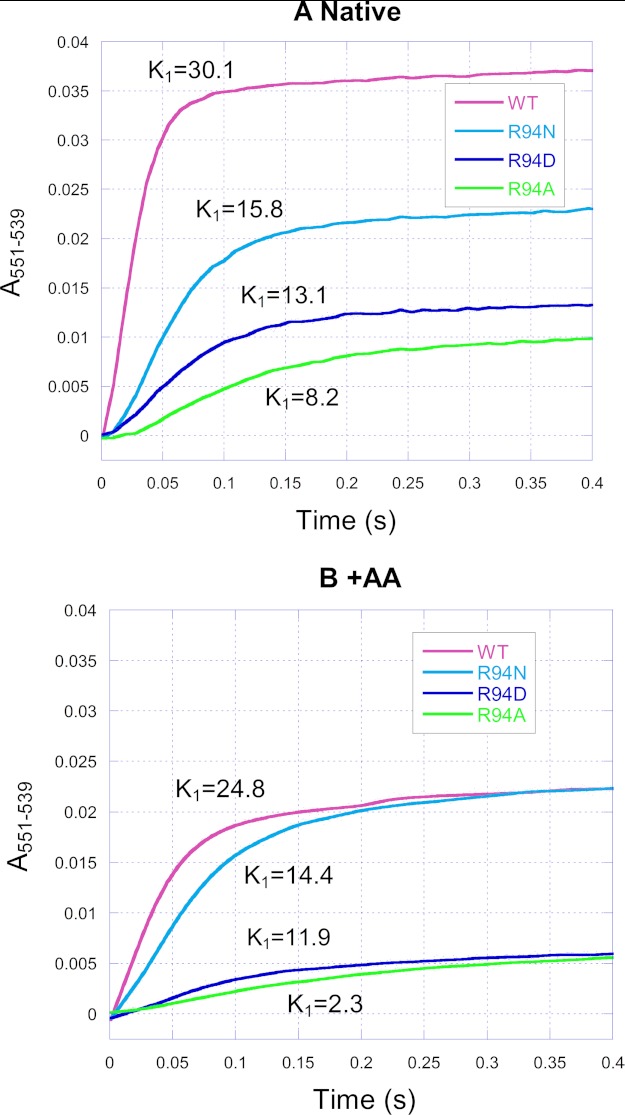
FIGURE 5.
Time traces of cytochrome c1 reduction by Q0C10BrH2 in the wild-type and mutant complexes in the absence (A) and presence (B) of antimycin A. Reactions and measurements were performed as described under “Experimental Procedures.” The reaction was monitored by photodiode array scanning for 0.4 s. Cytochrome c1 was determined from the increase in A551–539. AA, antimycin A.

