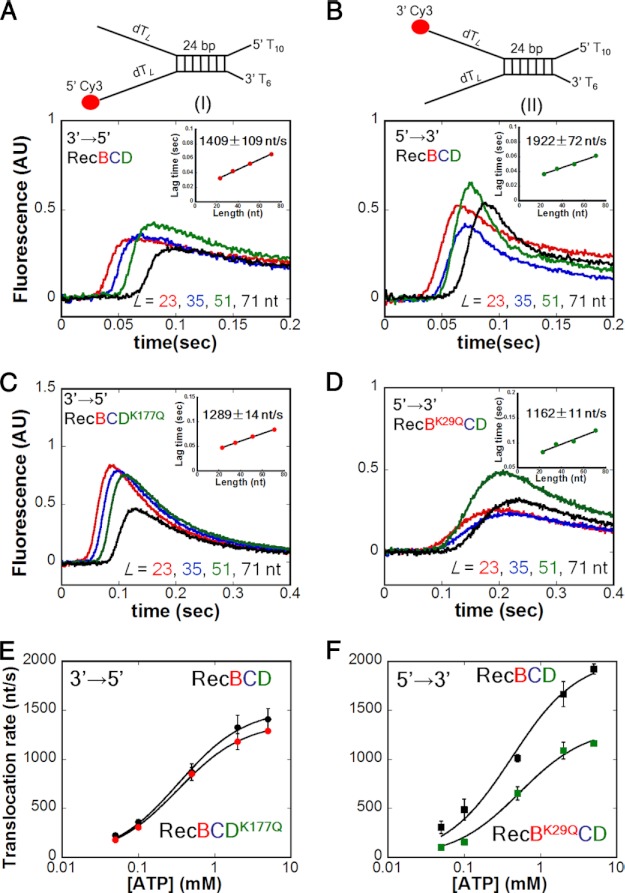
FIGURE 2.
The rate of RecBCD translocation along ssDNA in the 5′ to 3′ direction is faster than in the 3′ to 5′ direction, and the rates are coupled asymmetrically. Stopped-flow experiments were performed by mixing a preformed complex of RecBCD (37.5 nm) and DNA (50 nm) with 5 mm ATP, 10 mm MgCl2, and 7.5 mg/ml heparin (concentrations after mixing) in buffer M250 at 25 °C. The lengths of the twin ssDNA extensions, L, are indicated. All insets show the linear dependence of lag time on ssDNA extension length L. A, monitoring 3′ to 5′ ssDNA translocation of RecBCD using DNA I. Inset, rate = 1409 ± 109 nt/s. B, monitoring 5′ to 3′ ssDNA translocation of RecBCD using DNA II. Inset, rate = 1922 ± 72 nt/s. C, monitoring 3′ to 5′ ssDNA translocation of RecBCDK177Q using DNA I. Inset, rate = 1289 ± 14 nt/s. D, monitoring 5′ to 3′ ssDNA translocation of RecBK29QCD using DNA II. Inset, rate = 1162 ± 11 nt/s. E, [ATP] dependence of the 3′ to 5′ translocation rates of RecBCDK177Q (red) and WT RecBCD (black). For WT RecBCD, Km = 337 ± 30 μm and Vmax = 1515 ± 33 nt/s; for RecBCDK177Q, Km = 327 ± 14 μm and Vmax = 1377 ± 14 nt/s. F, [ATP] dependence of the 5′ to 3′ translocation rates of RecBK29QCD (green) and WT RecBCD (black). For WT RecBCD, Km = 420 ± 89 μm and Vmax = 2037 ± 109 nt/s; for RecBK29QCD, Km = 534 ± 84 μm and Vmax = 1325 ± 56 nt/s. AU, arbitrary units.

