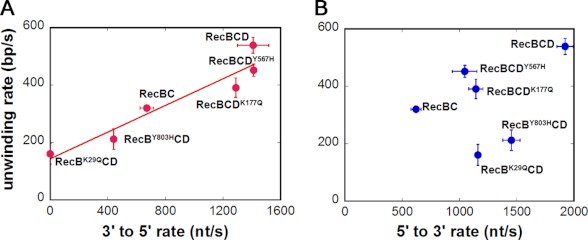
FIGURE 5.
Comparison between ssDNA translocase activities and helicase activity within RecBCD. A, 3′ to 5′ translocase activity is correlated with the helicase activity. The linear fit is introduced to show the correlation. B, 5′ to 3′ translocase activity is not correlated with the helicase activity. Error bars represent S.D.

