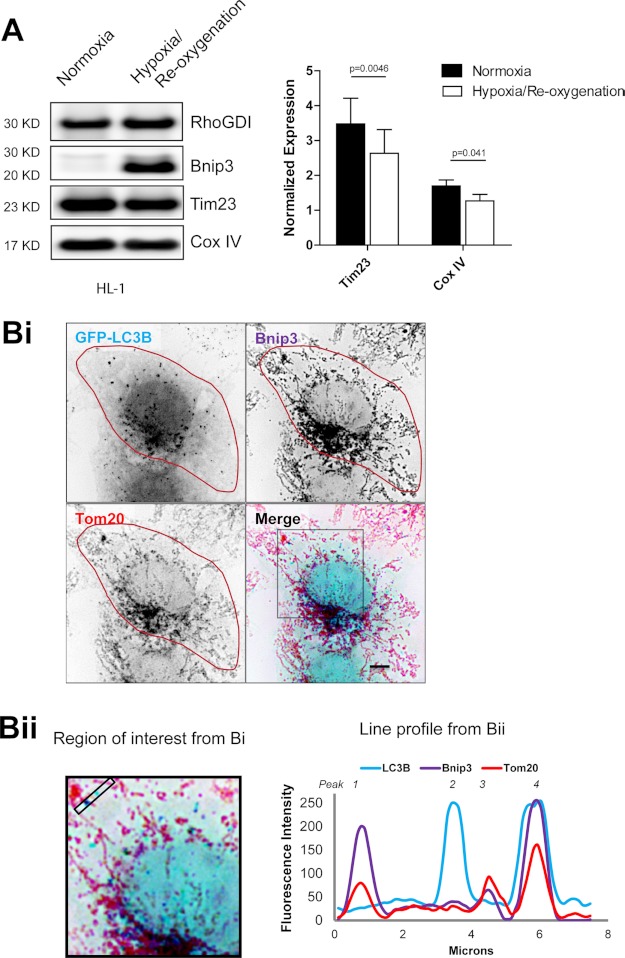
FIGURE 1.
Bnip3 up-regulation correlates with mitochondrial autophagy in cardiac HL-1 cells. A, hypoxia/reoxygenation increased Bnip3 expression and decreased mitochondrial content. HL-1 cells were submitted to 18 h of hypoxia, followed by 2 h of reoxygenation Western blot detection of mitochondrial markers Tim23, COXIV, Bnip3, and RhoGDI as a loading control. Shown is densitometric quantification of Tim23 and COXIV, normalized to RhoGDI. B, immunodetection of endogenous Bnip3 targeted to mitochondria, where it colocalized with GFP-LC3B following hypoxia/reoxygenation. Bi, HL-1 cells expressing GFP-LC3B were submitted to 18 h of hypoxia, followed by 2 h of reoxygenation. GFP-LC3B-labeled autophagosomes (pseudocolored light blue) and antibody labeled Tom20 (red) and Bnip3 (purple) were imaged by high resolution microscopy. Bnip3-targeted mitochondria that colocalized with autophagosomes appear dark blue. Bii, the region of interest from Bi is magnified, and the ImageJ plot profile function was used to illustrate colocalizations within the bounded region between autophagosomes (blue), Bnip3 (purple), and Tom20 (red). Error bars, S.E.

