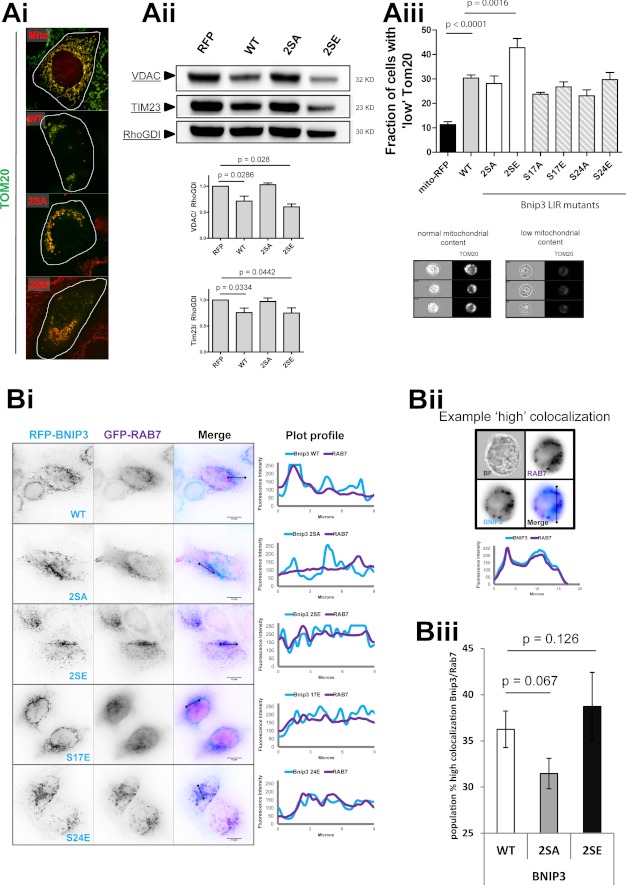
FIGURE 6.
Bnip3 LIR phosphorylation regulates maturation and autophagic degradation of mitochondria. A, mitophagy is enhanced by Bnip3 LIR phosphorylation. RFP-Bnip3 WT and the indicated multisite and single site mutant constructs were expressed in HeLa cells for 48 h. Ai, high resolution imaging of RFP-Bnip3-targeted mitochondria immunolabeled for Tom20 (green). Aii, Western blot analysis of mitochondrial protein levels. HeLa cells expressing RFP or the indicated RFP-Bnip3 construct were harvested 48 h after transfection and analyzed by Western blot. The levels of Tim23 and VDAC were quantified by densitometric analysis and normalized to RhoGDI. Aiii, use of MIFC to quantify subpopulations of cells with high mitophagy (low mitochondrial mass) through detection of mitochondrial Tom20 content in cell populations. Example phenotypes of high and low Tom20-labeled cells are shown below the graph. B, LIR phosphorylation enhances Bnip3 targeting to lysosomes. Bi, RFP-Bnip3 WT and indicated multisite and single site mutant constructs were co-expressed with the endolysosomal marker GFP-Rab7 in HeLa cells for 24 h. Shown are plot profiles of Bnip3 (light blue) and Rab7 (purple) demonstrating localizations of Bnip3-targeted mitochondria and autolysosomes. Bii, MIFC analysis of Bnip3 WT, 2SA, and 2SE colocalization with the endo-/lysosomal marker Rab7. The indicated Bnip3 constructs were expressed with GFP-LC3B in cardiac HL-1 cells for 24 h and imaged using the ImageStream X flow cytometer. Representative images and plot profiles are shown. Biii, using MIFC, the subpopulation of Bnip3 WT-targeted mitochondria with high GFP-Rab7 colocalization was quantified, gating on the fraction of cells with high colocalization. Population fractions are indicated as well as the percentage change of the two Bnip3 mutants compared with Bnip3 WT. Error bars, S.E.

