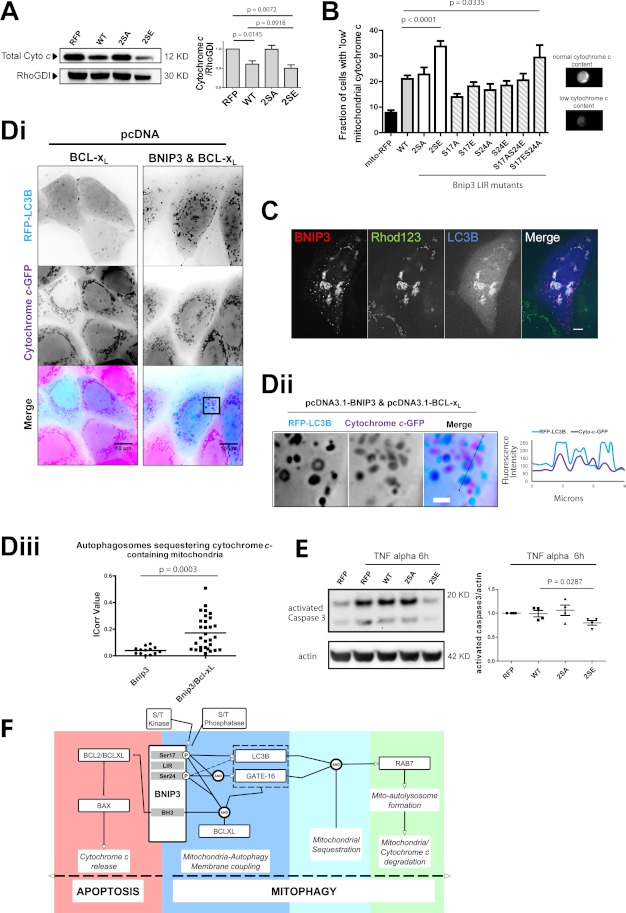
FIGURE 8.
Mimicked phosphorylation of Bnip3 LIR promotes mitochondrial cytochrome c degradation. A, quantification of cellular cytochrome c levels by Western blot. HeLa cells expressing RFP or the indicated Bnip3 construct were harvested 48 h after transfection and analyzed via Western blot. The levels of cytochrome c were quantified by densitometric analysis and normalized to RhoGDI. Cellular cytochrome c content was found decreased in RFP-Bnip3 WT and RFP-Bnip3 2SE-expressing cells, compared with cells expressing RFP. B, cellular cytochrome c content regulation by LIR phosphorylation. RFP-Bnip3 WT and indicated multisite and single site mutant constructs were expressed in HeLa cells for 48 h. Subpopulations of cells with low mitochondrial cytochrome c content were quantified by MIFC detection of mitochondrial cytochrome c. Example phenotypes of high and low cytochrome c-positive cells are shown below the graph. C, MCF-7 cells expressing RFP-Bnip3 2SE and BFP-LC3B for 24 h were stained with rhodamine 123 (Rhod123; 50 nm) to assess mitochondrial polarization state. D, Bnip3-induced mitophagy of cytochrome c-containing mitochondria is enhanced by Bcl-xL. Di, RFP-LC3B and Bcl-xL alone or in combination with Bnip3 were expressed in MCF-7 cells stably expressing cytochrome c-GFP. At 24 h, high resolution imaging was performed. Dii, enlarged region of Bnip3/Bcl-xL cell in i. The plot profile illustrates colocalizations between Bnip3-targeted mitochondria and autophagosomes in the enlarged region. iii, autophagosome sequestration of cytochrome c-containing mitochondria, in the presence of Bnip3 and Bnip3/Bcl-xL expression, was quantified using the ImageJ colocalization color map plugin. Dot plots indicate the data set distribution and mean correlation index (Icorr) ± S.E. of at least 10 cells (Z-stacks) per condition. E, effect of Bnip3-induced mitophagy on caspase 3 activation. Following 24 h of expression of RFP, RFP-Bnip3, RFP-Bnip3 2SA, or RFP-Bnip3 2SE, HeLa cells were treated with TNFα for 6 h and analyzed by Western blot. The levels of active caspase-3 were quantified by densitometric analysis and normalized to actin. F, schematic for Bnip3 regulation and interactions that form the cell fate decision of apoptosis versus mitophagy. Error bars, S.E.

