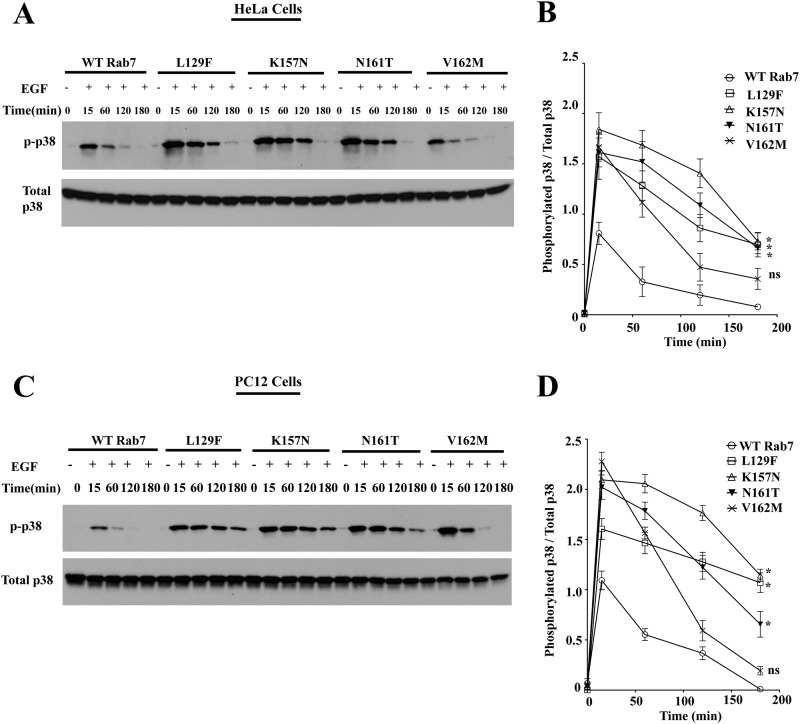
FIGURE 5.
Rab7 CMT2B mutants show enhanced p38 activation. A, HeLa cells stably expressing GFP-WT Rab7, GFP-Rab7L129F, GFP-Rab7K157N, GFP-Rab7N161T, and GFP-Rab7V162M were starved with DMEM for 5 h and stimulated with EGF (100 ng/ml) for the indicated times. Subsequently, cells were lysed, and equal amounts of protein were immunoblotted and probed for total and phosphorylated p38. B, films from three independent experiments were quantified densitometrically. The line graph shows levels of p-p38 in GFP-Rab7 WT- and CMT2B mutant-expressing cells. In each case, the amount of p-p38 was normalized to the total p38 protein expressed. Differences are represented as ±S.E. (error bars). C, PC12 cells stably expressing GFP-WT Rab7, GFP-Rab7L129F, GFP-Rab7K157N, GFP-Rab7N161T, and GFP-Rab7V162M were starved in DMEM for 5 h and stimulated with EGF (100 ng/ml) for the indicated times. Subsequently, cells were lysed, and equal amounts of protein were immunoblotted and probed for total and phosphorylated p38. D, films from three independent experiments were quantified densitometrically. The line graph shows levels of phosphorylated p38 in GFP-WT Rab7- and CMT2B mutant-expressing cells. In each case, the amount of phosphorylated p38 was normalized to the total p38 protein expressed. Differences are represented as ±S.E. *, p < 0.05 based on one-way ANOVA with Dunnett's post-test and relative to Rab7 wild-type control.

