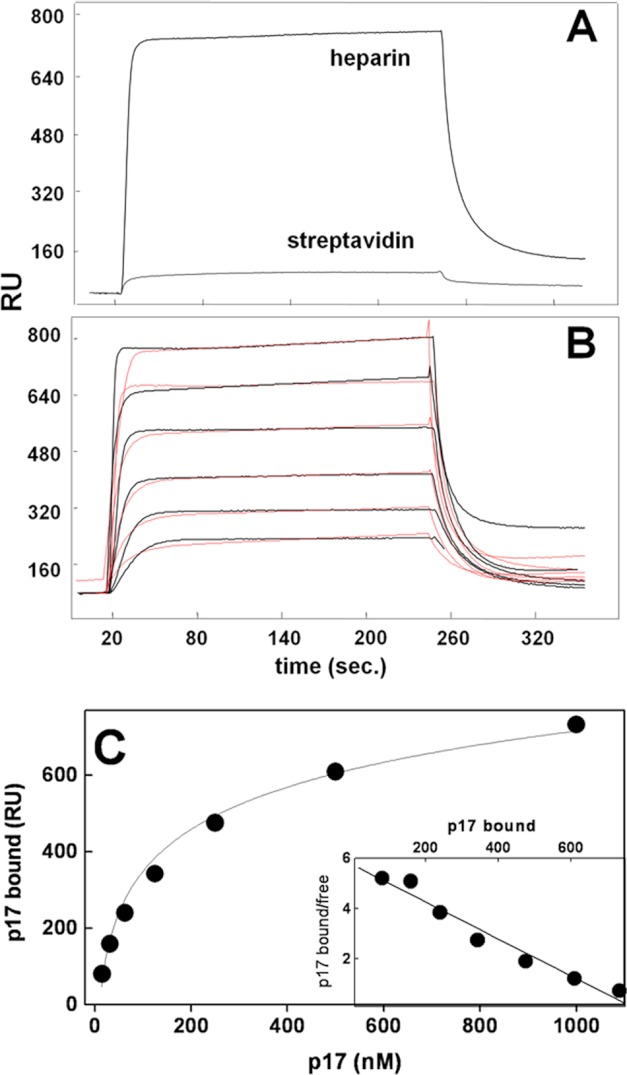
FIGURE 2.
SPR analysis of p17-heparin interaction. A, sensorgrams showing the binding of native p17 (500 nm) to a heparin- or streptavidin-coated sensorchip. B, blank-subtracted sensorgrams overlay showing the binding of increasing concentrations of native p17 (1000, 500, 250, 125, 62.5, and 31.25 nm) to a heparin-coated sensorchip. Black lines represent the experimental data. Red lines represent the fits. In A and B, the response (in RU) was recorded as a function of time. C, saturation curve obtained using the values of RU bound at equilibrium from injection of increasing concentrations of p17 onto a heparin-coated sensorchip. C, inset: Scatchard plot analysis of the equilibrium binding data shown in C. The correlation coefficient of the linear regression was equal to −0.96.

